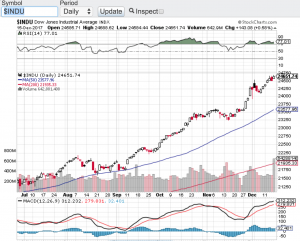
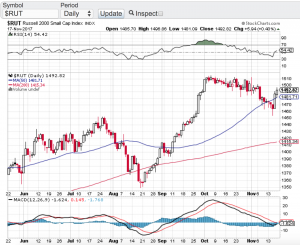
Big Time For Big Tech!

Large cap tech stocks have taken center stage this earnings reporting season big time! Absolute blowout earnings reports came in from Amazon (NasdaqGS: AMZN), the parent company of Google, Alphabet (NasdaqGS: GOOGL) and the elders of the group Intel Corp (NasdaqGS: INTC) and Microsoft (NasdaqGS: MSFT). These tech titans are the latest reason for the Nasdaq (chart) and S&P 500 (chart) to reach and close at record highs yet again. The Dow Jones Industrial Average (chart) and the small-cap Russell 2000 (chart) are also within striking distance of their all times highs. Market observers have attributed the strength in stocks this year to a continuing low interest rate environment and the upcoming new tax policy from the Trump administration. This I get, however, no one can deny the growth that is happening in the tech world as well as other sectors of the economy.

The one note of caution I have here is the exuberant environment we find ourselves in with record highs happening weekly and in some instances daily. Yes earnings reporting season so far has been stellar but let’s not forget that we have not seen price to earnings ratios this elevated in quite some time. The question that now comes to mind are the markets and the aforementioned stocks finally at fair value? Especially as the p/e’s increase and as we approach a much higher interest rate environment over the next two years. We have been in such an accommodative monetary state for almost a decade which without a doubt has been the catalyst for equities and indexes and now the federal reserve here in the U.S. is reversing course. One of the groups that get the most affected in a higher interest rate environment are growths stocks like the aforementioned tech titans.

I am not suggesting that these stocks will not continue their upward trajectory, but I am making note and will be paying closer attention to the overall price to earnings ratios of the indexes and of high growth stocks in general as p/e’s continue to elevate. Good luck to all 🙂

~George

Is It Time To Hedge?

As we remain in one of the strongest bull markets ever, is it time to hedge? Whoever has tried to short the market this year or for that matter the last nine years understands this has not been an effective strategy to say the least. However, as we are now entering the height Q3 earnings reporting season and as I mentioned in my previous blog implementing a hedge strategy could provide continuing beta should the bull market carry on yet offer profits in the event stocks or indexes go down. The strategy I am referring to is an options strategy called a “straddle”. A straddle is when an investor buys a call and a put option with the same strike price and expiration date with the selected strike price as close as possible to the current stock price of the underlying asset. Let’s take Intel as an example: Intel (NasdaqGS: INTC) closed on Friday at $39.67 and is scheduled report their earnings results on October 25th. Taking a look at the November $40 strike price on Intel, the call option is approximate $0.83 per contract and the put option is approximately $1.34 per contract. So if an investor/trader decides to put a straddle on Intel at this particular strike price, the total cost of the straddle is $2.17. You arrive at this number by simply adding up the cost of the put and call option. Where you profit from this trade is if Intel trades north or south of $40 by more than the total cost of the trade and before expiration.

One of the reasons why straddles can be effective during earnings reporting season is that earnings can be a huge catalyst for stock price movement. This especially rings true when a company surprises to the up or downside. With a straddle it does not matter which direction the underlying asset moves, so long at it moves greater than the total cost of the straddle. The risk with the straddle is if the underlying asset does not have a big move in either direction before the straddle expires. Options do have an expiration date so you have to make sure that the catalyst occurs before the expiration date and even then allow yourself time for the full potential to play out. I also look for the historic movement of a stock or index to see if it does move greater than the cost of any given straddle regardless of a “catalyst”. That said, options and options strategies are extremely risky and volatile and you should always consult with a certified financial planner before considering any new strategy. Good luck to all 🙂

~George

The Bears Are Baffled!

What is historically one of the weakest months of the year for stocks, the S&P 500 (chart) closed the week and halfway point of the month at an all time high of 2500. The Dow Jones Industrial Average (chart) also closed the week at a record high, along with the tech-focused Nasdaq (chart) and last but not least, the small-cap Russell 2000 (chart) appears to be closing in on a new record high as well.

The bear camp has to be completely exhausted. I mean how in the world can you have the confidence to short this market? Not even the continuation of North Korea’s missile launches can slow down one of the most significant bull markets in history. Now seemingly we need to throw out all traditional metrics, seasonalities, geo-political risks, price to earnings ratios etc. This market has been immune to any risks. I have never seen anything like this. What’s more, there are survey’s out there that indicate that professional investors are the most pessimistic about the markets since before the election. You know what that means? Stocks tend to act the opposite of street sentiment.

Over the years and as most of you know one of my favorite technical indicators and one of the preferred technical indicators of money managers and institutional trader alike is the relative strength indicator. This indicator has been a trusted source to spot overbought and for that matter oversold conditions. The problem I have encountered this year is when indexes or individual equities have reached an overbought condition according to the RSI, the pullbacks that ensue have not provided the proper risk reward to any short thesis. The retracements are so shallow and short-lived that it is not worth putting the trade on. So needless to say, this strategy is on hold for now.

I am not sure what will be the catalyst for stocks or indexes to begin trading on pure fundamentals and not on the oversupply of liquidity and low interest rates. Until then, I will be very cautious in using the traditional metrics and/or technical indicators to base my decisions off of. Good luck to all 🙂

~George

Is Gold Breaking Out?

It certainly appears that way. Gold (see chart below) has caught a meaning bid as of late and it’s about time. The yellow medal has been stuck in a trading range between $1200 and $1300 per ounce for months and now has broke through the $1300 level currently trading around $1330 per ounce. What has surprised me is how long it took for gold to finally go from the left side of the chart to the right. Especially considering the geopolitical risk environment we find ourselves in. That said, stocks are saying what risk? As I write this blog, the Dow Jones Industrial Average (chart), the S&P 500 (chart), the Nasdaq (chart) and the small-cap Russell 2000 (chart) once again are all approaching all time highs. This after a very modest pullback in August. So Wall Street continues to remain in the “buy the dip” mood. All year long and every single time stocks experience any type of pullback, buyers come in and lift the markets to all time highs.

How long can this last? From a technical standpoint the key indices remain below the 70 value level of the relative strength index also referred to as the RSI. The RSI is used as a gauge by certain market technicians to see if whether or not stocks in the short term are overbought or oversold. As as these indexes approach all-time highs and should they breakthrough those highs, these markets can and should continue to go higher. However, if they do not breakout here, then one could expect yet another pullback especially as we are now in one of the more underperforming months for equites of the year. Historically September and October for that matter tends to be a difficult time for the markets. However, based on what we have witnessed all year long despite the ongoing geopolitical risks and with interest rates on the rise, the markets may not care about the seasonality trends of September and October. Good luck to all and both Paula and I wish everyone a safe and relaxing Labor Day Weekend 🙂

~George

Gold chart - Paula Mahfouz

2 Percent – That’s It?

What should of been at least a 5-10% correction last week, the major averages barely flinched. This despite North Korea incessant threats of a nuclear attack against the U.S. and President Trump’s response that “fire and fury” will be unleashed by the U.S. in such an event. I am truly in disbelief that the markets did not take this geopolitical risk to correct in a more meaningful manner. In fact stocks yesterday had their best single day of the summer. Now we find ourselves yet again near all time highs. The Dow Jones Industrial Average (chart) closed just shy of 22,000, the S&P 500 (chart) is just under its all-time high of 2490, the Nasdaq (chart) closed at 6430 and the small-cap Russell 2000 (chart) closed Monday’s session at the 1395 level.

Talk about passive, machine driving algorithmic trading. One thing that really stands out to me is how the S&P 500 (chart), Nasdaq (chart) and the Russell 2000 (chart) all held their major moving average support lines. In particular the S&P and Nasdaq’s 50-day MA and take a look how powerful the Russell 2000’s 200-day moving average held and bounced (chart). It is clear that program trading models worked to perfection on this recent market pullback at least pertaining to key technical support levels.

So are we out of the woods pertaining to the risk trade? I am not so sure. But my goodness how can anyone have any kind of short thesis on these markets. Not even the heightened and continuing threat of a nuclear attack can rattle these markets more than 2 percent. Now that the rhetoric coming out of North Korea has abated for now, it could be business as usual as traders and investors get back to focusing on corporate earnings and fed policy. Whatever the case is I continue to be baffled by the strength of the U.S. stock market and without a doubt the old adage “don’t fight the tape” couldn’t be more true this year.

Good luck to all 🙂

~George

Dow 22,000 In Sight…

The Dow Jones Industrial Average (chart) closed the month of July at a record high and came within 70 points of the 22,000 mark. Just a few short months ago that the Dow surpassed the 21,000 milestone. What an incredible run in such a short period of time! Not only is the Dow Jones Industrial Average (chart) notching new record highs almost daily, the Nasdaq (chart) last Thursday posted a new record at 6460, as did the S&P 500 (chart) setting a new record of 2484. Last but not least, the small-cap Russell 2000 (chart) also set a new record last week of 1452. However, both the Nasdaq (chart) and the small-cap Russell 2000 (chart) have reversed their upward trajectory over the last few trading sessions in a noticeable manner. Let’s keep an eye on this development.

I think it is safe to say that Q2 earnings reporting season has helped fuel the Dow Jones to new record highs as well as the S&P 500. Tech stocks have been reporting a mixed bag so far this earnings reporting season which is why that index has started to abate a bit. All eyes today are on Apple (NasdaqGS: AAPL) which report their earnings results after the close. This could be the one stock that either reverses the latest mini-downward trend in the Nasdaq or for that matter, accelerate it. As I look to the technical shape of the the aforementioned indexes, only the Dow Jones Industrial Average (chart) is on overbought territory, while the S&P 500 (chart), Nasdaq (chart) and the small-cap Russell 2000 (chart) have begun their reversion to the mean and are all approaching the 50 value level of the relative strength index.

Game plan for August? Personally, I think it is time to reduce long exposure to equities due in part to this startling run stocks have had all year long. This coupled with the month of August being an historically weak month for equities could create the perfect set up for the much anticipated market correction that the bears have been waiting on. That said, I have to remind myself that there has been no such thing as typical in these markets for we have been in unchartered territory for a long period of time. One final note, it is always recommended to consult with a certified financial planner before making any adjustments to your portfolio.

Good luck to all 🙂

~George


Record After Record!

Another week in the books and records continue to fall. The Dow Jones Industrial Average (chart) and the S&P 500 (chart) both closed the week at record highs, while the Nasdaq (chart) and the small-cap Russell 2000 (chart) are within a stones throw from their all-time highs. These key indices have been setting records all year long. With the exception of a few minor pullbacks throughout the year, stocks have pretty much gone up in a straight line. This despite a very tepid economic recovery here in the United States with the GDP coming in at a modest increase of 1.4%.

I think it is safe to say that this latest record setting week was due in part to Federal Reserve Chairman Janet Yellen’s dovish comments regarding interest rates and that the Fed would be very gradual in its future hikes and that such action will be determined by how well the economy fares. If the latest retail sales numbers and consumer price index number are indicative of what the Fed will do, we may not see another hike until year end or even 2018? This is just what the markets needed in order to keep a floor not only under the stocks, but the confidence to proceed as business as usual hence record setting highs.

Well the old adage of you can’t fight the tape or the Fed for that matter is certainly playing out so far in 2017. Are there any catalysts out there that could change the markets mind or its direction? Well we are about to enter the busiest week of Q2 earnings reporting season so far with over 440 companies reporting their results next week including the likes of Netflix (NasdaqGS: NFLX), Goldman Sachs (NYSE:GS), International Business Machine (NYSE: IBM), Johnson & Johnson (NYSE: JNJ), United Airlines (NYSE: UAL), American Express (NYSE: AXP), eBAY INC. (NasdaqGS: EBAY) and General Electric (NYSE: GE) just to name a few. The following week over 1400 companies will report their quarterly results. So if there is anything that could slow this bull market down right now this is it. However, if corporate America continues to report solid earnings results, new record highs could very well continue into the foreseeable future. Good luck to all 🙂

~George


Tech Stocks Hit The Brakes!

After going up in a straight line for months, the technology sector (see chart below) has reversed its upward course. After hitting an all-time high of 6341.70 on June 9th, the Nasdaq (chart) has given back 190 points or three percent while approaching its 50-day moving average. Nowadays it’s pretty rare to see a one percent pullback in tech stocks let alone a three percent retracement in a week. The media is now all over how tech stocks today are beginning to resemble the internet bubble. The difference between today and yesteryear is that the top five tech stocks – Amazon (NasdaqGC: AMZN), Apple (NasdaqGC: AAPL), Facebook (NasdaqGS: FB) Google’s parent company Alphabet (NasdaqGC: GOOGL) and Microsoft (NasdaqGC: MSFT) have been responsible for a big chunk of the Nasdaq and S&P 500 (chart) recent gains. The problem with comparing today’s market with the internet bubble is that the aforementioned tech leaders all have incredible balance sheets while continuing to grow at a pace that supports their relative stock prices. One may argue that Amazon remains overpriced especially with its lofty P/E ratio.

It’s hard to imagine that anyone would be concerned about a three percent pullback in any stock or index, but because of how strong stocks have been since the election, anything other than a flat to up day will get noticed. That said, without question all eyes will be on whether or not the Nasdaq’s 50-day moving average will get tested. The last time the Nasdaq (chart) did not hold its 50-day support line was last October. Since then tech stocks have tested and moved off of its 50-day average multiple times. 6085 is the current the 50-day moving average of the Nasdaq which is about 65 points away. I am not suggesting it will go there, but if it does and according to the way tech stocks have reacted to that particular support line, a bounce could be in the cards. Good luck to all 🙂

~George

Nasdaq chart - George Mahfouz Jr

Are Energy Stocks And Banks Cracking?

As technology stocks continue to tick up to new record highs, banks and even more so energy stocks are showing signs of weakness. Yesterday, the Nasdaq (chart) hit an all time high of 6221.99 and the S&P 500 (chart) also notched a record recently at 2418.71. That said, the energy sector has lost almost 10 percent in the last month or so and the banking sector is beginning to technically breakdown. A very noticeable divergence is happening here and I think it is time to pay attention to this recent dynamic. The Dow Jones Industrial Average (chart) remains above 21000 and the small-cap Russell 2000 (chart) is seeking direction.

I am not surprised that certain sectors of the market are showing weakness which is only normal with the tremendous run the markets have had since the election, however, it is the sectors that are breaking down that is a bit alarming to me. One has to ask is the price action in oil and energy stocks indicative of weakening demand hence a weakening economy? Or is this just a matter of too much supply in oil regardless of the O.P.E.C. commitment to its production cuts. As far as the banks are concerned, one would also think with the Federal Reserve raising interest rates at their upcoming meeting in June and committing to additional rate hikes this year. that this would be bullish for bank stocks. Not the case recently. I am a little perplexed to the way the tape has been acting as of late especially pertaining to the aforementioned sectors.

The technical shape of the key indices appear to be intact with the exception of the small-cap Russell 2000. The Dow Jones Industrial Average (chart) is trading well above its 50-day moving average, along with the S&P 500 (chart)  trading near all-time highs and the Nasdaq (chart) as mentioned above hit an all-time high yesterday. However, the small-cap Russell 2000 (chart) is trading below its 50-day moving average and has been challenging certain support zones lately. This is yet another potential alarm along with the energy and banking sector weakness lately. So I would not be surprised to see the selling pressure in these particular sectors continue in the month of June which is historically one of the weakest month of the year for stocks. Good luck to all 🙂

~George

No Fear Here…

Despite North Korea launching its seventh missile test of the year on Sunday and the White House seemingly in an upheaval, stocks continue to demonstrate no fear and continue their record setting ways. Today the S&P 500 (chart) and the Nasdaq (chart) hit all time highs. Without question this bull market is now even catching wall street veterans off guard. Q1 earnings reporting season is close to wrapping up and other than retail, most companies have reported in-line or outright beats in their earnings results, especially the tech sector. Tech has been on fire lately and this is due in large part of mega-cap tech smashing analysts expectations. Earnings results from companies such as Apple (NasdaqGS: AAPL), Amazon (NasdaqGS: AMZN), Alphabet (NasdaqGS: GOOGL) and Facebook (NasdaqGS: FB) has propelled the Nasdaq (chart) and these particular issues to all-time highs. The Dow Jones Industrial Average (chart) and the Russell 2000 (chart) remain in striking distance of setting new records as well. It is truly remarkable how the markets have been able to weather the current political environment here in the U.S. and the geopolitical risks abroad.

From a technical perspective, the aforementioned key indices are in pretty good shape. The Nasdaq (chart) is the only one of the four that remains in overbought territory according to the relative strength index. All of these averages also remain above their respective 50-day and 200-day moving averages, yet another bullish sign. Volatility also remains at historic lows. So one may ask what about the “sell in May and go away” adage? From a technical standpoint, I do not see any reason why these markets won’t continue to melt up from here. Of course there is always the risk of a geopolitical event or the actual seasonal risk of assets taking a pause or retracing a bit. That said and whatever the case may be, it is undeniable that the markets have been the most resilient in years, if ever.

Good luck to all 🙂

~George