No Surprise Here…

It’s no surprise here that the month of August was weak for the overall stock market. Despite the current economic backdrop historically August tends to underperform compared to the rest of the year. The Dow Jones Industrial Average (see chart here) last month closed down over 1000 points and the S&P 500 (see chart here) closed below the 4000 mark. The Nasdaq Composite (see chart here) gave up over 500 points and the small-cap Russell 2000 (see chart here) pulled back slightly. That being said and considering the current headwinds we are facing I believe stocks held up pretty well.

Now that we are in September and from a seasonal perspective especially with mid-terms approaching, I anticipate volatility to continue. There is also a possibility that vol will accelerate. Looking at the current backdrop, we have a Federal Reserve that continues to raise interest rates, corporate earnings are stagnating and the political situation in our country is nothing to be proud of now. Taking all of these factors into consideration, plus the constant flow of negative news, August could off sold off a lot more. Out of all these dynamics I prefer to tune out most all of the noise and really study how the Federal Reserve is navigating itself through this cycle. To me it is this entity that swings the biggest bat on how the markets move. As you know by now, I also pay attention to the technical shape of the key indexes.

Speaking of the technical shape of the market, let’s take a look. The Dow Jones Industrial Average (see chart here) is trading below its 20 day, 100 and 200 day moving averages. The S&P 500 (see chart here) is also experiencing a technically weak pattern as is the Nasdaq Composite (see chart here) and the Russell 2000 (see chart here). Again, no surprise here but I did notice the markets today appeared to find some support. For the markets the dog days of summer are almost over, but I think we all need to buckle up between now and the mid-terms because I do expect volatility to continue.

Good luck to all and have a great and safe Labor Day Holiday!

~George
Third Rate Cut Of The Year…

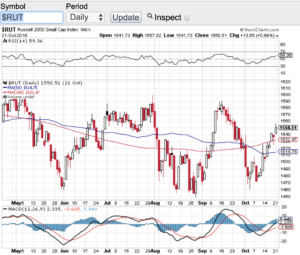
The Federal Reserve provided its third rate cut of the year on Wednesday. Although this was very much expected, until it happens you don’t know. Without question the Fed’s actions this year has helped the markets hit new highs throughout the year. This week has been no different. Despite pulling back a bit yesterday the Dow Jones Industrial Average (see chart here) remains above 27000, the S&P 500 (see chart here) hit a fresh all-time high on Wednesday, the Nasdaq Composite (see chart here) is within 50 points of its all time high and the small-cap Russell 2000 (see chart below) is trading above its 20, 50, 100 and 200-day moving averages. A technically healthy sign.

What has allowed the Federal Reserve to be proactive in cutting rates is the fact that inflation is pretty much non-existent. If inflation was present in a meaningful way I am not sure the Fed would be cutting rates at all. A huge side effect to lower rates is a strong stock market. So it’s no wonder we continue to trade at new highs and at the very bare minimum hold strong near the upper bands of the trading range. A couple of other factors that are supporting the markets are the latest round of corporate earnings reports which are coming in a bit better than expected along with some positive news flow out of the China trade negotiations.

With this latest rate cut I would not be surprised to see a continuation of the current upward trend and also potentially see new all-time highs before year-end. As I look at the technical shape of the aforementioned indexes pertaining to the relative strength index and the moving averages, I don’t see any issues there either. The Dow Jones Industrial Average (chart), the S&P 500 (chart), the Nasdaq Composite (chart) and the Russell 2000 (chart) are all above their respective moving averages which historically provides support on pullbacks and none of these indexes are in overbought territory  according to the relative strength index (RSI) principles.

Good luck to all 🙂

~George

Third Rate Cut Of The Year - Paula Mahfouz


2 Percent – That’s It?

What should of been at least a 5-10% correction last week, the major averages barely flinched. This despite North Korea incessant threats of a nuclear attack against the U.S. and President Trump’s response that “fire and fury” will be unleashed by the U.S. in such an event. I am truly in disbelief that the markets did not take this geopolitical risk to correct in a more meaningful manner. In fact stocks yesterday had their best single day of the summer. Now we find ourselves yet again near all time highs. The Dow Jones Industrial Average (chart) closed just shy of 22,000, the S&P 500 (chart) is just under its all-time high of 2490, the Nasdaq (chart) closed at 6430 and the small-cap Russell 2000 (chart) closed Monday’s session at the 1395 level.

Talk about passive, machine driving algorithmic trading. One thing that really stands out to me is how the S&P 500 (chart), Nasdaq (chart) and the Russell 2000 (chart) all held their major moving average support lines. In particular the S&P and Nasdaq’s 50-day MA and take a look how powerful the Russell 2000’s 200-day moving average held and bounced (chart). It is clear that program trading models worked to perfection on this recent market pullback at least pertaining to key technical support levels.

So are we out of the woods pertaining to the risk trade? I am not so sure. But my goodness how can anyone have any kind of short thesis on these markets. Not even the heightened and continuing threat of a nuclear attack can rattle these markets more than 2 percent. Now that the rhetoric coming out of North Korea has abated for now, it could be business as usual as traders and investors get back to focusing on corporate earnings and fed policy. Whatever the case is I continue to be baffled by the strength of the U.S. stock market and without a doubt the old adage “don’t fight the tape” couldn’t be more true this year.

Good luck to all 🙂

~George

First Half Of The Year In The Books, And The Bull Keeps Running…

After gaining 30% or so in 2013, the markets continue to be on one of the most impressive bull runs in modern history. Here is how the four key indices closed out the first half of 2014: The Dow Jones Industrial Average (chart) finished up 1.5%, the Nasdaq (chart) gained 5.5%, the S&P 500 (chart) advanced 6.1% and the small-cap Russell 2000 (chart) closed out the first half of 2014 up 2.6%. Looking back to the market lows of early 2009, these aforementioned indices have tripled or better in price, which is simply stunning.

I think now is as good a time than any to begin to take a look at how the major averages can continue to rise in spite of almost tripling over the past 5 1/2 years. What could be the catalyst(s) going forward? It’s no secret that the Federal Reserve is scaling back its asset purchases and are scheduled to be finished by year-end, so no surprise there. This in fact is where the bear camp is growling that the end of the Fed stimulus program could be the catalyst to end this historic bull run. What about corporate earnings? In my humble opinion, herein lies the single most important catalyst that will either add fuel to this incessant bull run or put the brakes on it. If it’s the latter, this could also create the first real correction in stocks, something that hasn’t occurred in years.

Investors will not have to wait too much longer for Q2 earnings reporting season is upon us. The first key earnings release that has economic implications will be Alcoa (NYSE: AA) which is due to report next Tuesday after the close. I will be very interested to see the top-line growth of Alcoa which will certainly shed some light as to the health of the global economy. Investors have been bidding up Alcoa most of the year in anticipation of an expanding global backdrop. Another economically sensitive stock at least as it pertains to the consumer is Family Dollar Stores (NSYE: FDO). Family Dollar is scheduled to report their quarterly results next Thursday before the market opens. Then by mid-July we will be in high gear to hear how corporate america fared in Q2. The week of July 14th, earnings are scheduled to come out of American Airlines (NYSE: AAL), American Express (NYSE: AXP), Blackrock ( NYSE: BLK), Citigroup (NYSE: C), Whirlpool Corp (NYSE: WHR), JPMorgan Chase (NYSE: JPM) Goldman Sachs (NYSE: GS), Johnson & Johnson (NYSE: JNJ), Intel (NasdaqGS: INTC), Yahoo (NasdaqGS: YHOO), Bank of America Corp (NYSE: BAC), Ebay (NasdaqGS: EBAY), U.S. Bancorp (NYSE: USB), Yum Brands (NYSE: YUM), Baker Hughes Inc (NYSE: BHI), UnitedHealth Group (NYSE: UNH),  Blackstone Group LP (NYSE: BX), International Business Machine (NYSE: IBM), Google (NasdaqGS: GOOGL), Bank of New York Mellon Corp (NYSE: BK) and General Electric (NYSE: GE) just to name a few. As you can see, I think it is safe to say that by the middle of July or so we will have a pretty good idea of how corporate America is faring.

Please note that in recognition of the 4th of July holiday, the markets will be closing at 1pm E.S.T. on Thursday and is closed on Friday the 4th. Both Paula and I wish everyone a very safe and happy 4th of July 🙂

~George


Q1 Earnings Reporting Season Saves The Day, So Far…

Last week the Dow Jones Industrial Average (chart), the Nasdaq (chart), the S&P 500 (chart) and the small-cap Russell 2000 (chart) all went into a tailspin closing lower by 2.4%, 3.1%, 2.6% and 3.6% respectively. Fast forward to this week as earnings reporting season shifted in to high gear and we have a different story. For this holiday shortened week, the Dow Jones Industrial Average (chart) finished up 2.38%, the Nasdaq (chart) closed up 2.395%, the S&P 500 (chart) gained 2.7% and the small-cap Russell 2000 (chart) closed the week up 2.38%.

So why the reversal? Simply put and for the most part, corporate earnings are coming in better than expected. At the beginning of the week Citigroup (NYSE: C) posted better than expected results on net income of $3.94 billion up from $3.81 billion in Q1 2013. This was after Wells Fargo (NYSE: WFC) posted a sharp rise in its net income in comparison to last year’s quarterly results. Also this week, Johnson and Johnson (NYSE: JNJ) reported a net income of $4.4 billion an almost 8% increase over the same period last year. The Coca-Cola Co. (NYSE: KO) reported their Q1 earnings booking 44 cents share which is what the street expected as global sales volume rose 2%. Furthermore, Intel (NasdaqGS: INTC) reported 38 cents a share in earnings which came in 1 cent above what analysts expected, this was enough to send Intel to fresh 52-week highs.  Yet another impressive earnings report came out of flash based data storage firm SanDisk (NasdaqGS: SNDK) which surprised the street and reported record Q1 results of $1.44 per share leapfrogging street estimates of $1.25 per share. This was enough to send the shares of the company up over 7% in today’s trading session.

As previously mentioned, earnings reporting season kicked into high gear this week and next week we go into overdrive. At the beginning of this upcoming week, we will here from Halliburton (NYSE: HAL), Wynn Resorts (NasdaqGS: WYNN), AK Steel (NYSE: AKS), Amgen (NasdaqGS: AMGN), Bank of New York Mellon (NYSE: BK), Cree Inc. (NasdaqGS: CREE), Discover Financial Services (NYSE: DFS), Gilead Sciences (NYSE: GILD), Juniper Networks (Nasdaq: JNPR), Intuitive Surgical (NasdaqGS: ISRG) and United Technologies Corp (NYSE: UTX). Mid-week earnings will come out of tech behemoth Apple (NasdaqGS: AAPL), Biogen Idec (NasdaqGS: BIIB), Delta Airlines (NYSE: DAL), Dow Chemical (NYSE: DOW), F5 Networks (NasdaqGS: FFIV), Facebook (NasdaqGS: FB) and Qualcomm (NasdaqGS: QCOM). Closing out the week we will hear from 3M Company (NYSE: MMM), Amazon (NasdaqGS: AMZN), American Airlines (NYSE: AAL), Chinese search engine Baudi (NasdaqGS: BIDU), Cabot Oil & Gas (NYSE: COG), Celgene Corp (NasdaqGS: CELG), Eli Lilly and Company (NYSE: LLY), General Motors (NYSE: GM), KLA-Tencor (NasdaqGS: KLAC), Microsoft (NasdaqGS: MSFT), United Parcel Service (NYSE: UPS) and Ford Motor Company (NYSE: F). Of course there are hundreds of others reporting their earnings next week so we will see if the market continues to rebound from its mini sell-off earlier in the month. Good luck to all.

The markets will be closed tomorrow in recognition of Good Friday and both Paula and I wish everyone a very safe and healthy holiday weekend 🙂

~George


Chalk one up for the bears…

The month of August proved to be the most challenging for the bulls in over a year. For the month, the Dow Jones Industrial Average (chart) closed down 4.45%, the tech-heavy Nasdaq (chart) -1.01%, the S&P 500 (chart) -3.13%, and the small-cap Russell 2000 (chart) finished the month lower by 3.29%. There are many factors that one can point the finger to as to why equities retraced last month, however, let’s keep in mind that on the year, these key indices are still up double digits with the Nasdaq (chart) and Russell 2000 (chart) leading the way up nearly 20%.

In my last blog, I questioned whether or not the weakness in August was a mere pause in this incessant bull run, or a preview of things to come? I think we will most certainly get this answer here in September and as early as this upcoming week. Between the crisis in Syria and what the ramifications could be after the possible airstrikes, to a slew of economic reports which culminates on Friday with the August employment report. Friday’s jobs report is expected to be the determining factor as to if and how much the Fed will begin to reduce its bond purchases. The Fed taper seemingly is all we have heard about since the beginning of summer and is part of the reason for the recent increase in volatility. Traders really don’t know what to expect once quantitative easing begins. For years the markets have had the back stop of the Federal Reserve and from central banks around the world. Personally, I think that once the Fed begins to pullback its bond purchases, we will then begin to see a more realistic market environment. This would be an environment that investors and traders can finally gauge their actions from true economic and corporate earnings performances, rather than what the Fed will or will not do. With that said, I expect volatility to continue to increase with a more normal ebb and flow of asset prices.

Technically speaking, the Dow Jones Industrial Average (chart), the S&P 500 (chart) and the Russell 2000 (chart) are all now trading below their 50-day moving averages  which is something I am paying close attention to now. In the coming days if the Nasdaq (chart)  joins in and begins trading below its 50-day, we could be in for very choppy trading and another leg down in September. Good luck to all.

Happy Labor Day 🙂

~George

Is risk back off?

On the last trading day of May, the Dow Jones Industrial Average (chart) sold off by 208.96 points, the Nasdaq (chart) -35.38, the S&P 500 (chart) -23.67 and the small-cap Russell 2000 (chart) finished the day lower by 10.28 points. Is this a possible prelude for the month of June? After the six-month+ run that stocks have been on, one has to wonder if these markets are poised to correct?

As I wrote in mid-May, I expected volatility to begin to increase, and sure enough the VIX (chart) also known as the fear gauge spiked 27.5% over the past two weeks. Ever since the Fed began mapping out an exit strategy, the market chatter has steadily increased as to how stocks and bonds would react. Furthermore, since its May policy meeting, the Fed has had a difficult time communicating its position as to how it will move forward. I know that some type of jaw boning needs to occur in order to prepare the markets for the beginning of monetary easing. However, a policy statement at the beginning of May indicated that the Fed’s next move could either be up or down? Confusing isn’t it? So it’s no wonder some sort of fear has begun to creep into these markets.

That said, this has become such an unprecedented market environment, I don’t know what to think right now. Isn’t the job market, corporate earnings, and top-line growth supposed to drive stocks? What I and many on the street are concerned with is the day the Fed decides to begin its wind down, how will equities react? Next week I will be paying close attention to the plethora of economic reports that will be issued which includes the PMI and ISM manufacturing indexes, the Beige Book and of course the all important Jobs report which will be issued on Friday before the market open, just to name a few. If the economy can begin to demonstrate meaningful strength, then any type of pullback or correction will most likely be met with wide support. However, if economic numbers stay weak, then we could very well be in for a lot more volatility this summer. Good luck to all.

Have a great weekend 🙂

~George