Trading Between The Lines…

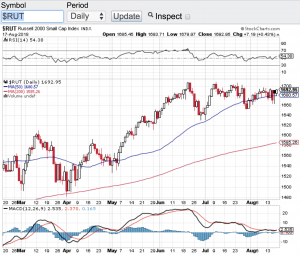
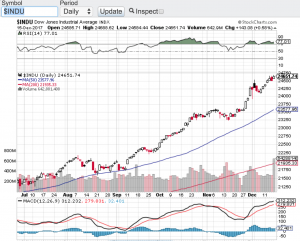
Trading between the lines is how this August is playing out so far. In what is supposed to be a seasonal volatile period, August seemingly has been playing right to the tune of this almost decade long bull market. The Dow Jones Industrial Average (chart), the S&P 500 (chart), the Nasdaq Composite (see chart) and the small-cap Russell 2000 (see chart below) to my surprise have all traded in a tight range this month. Furthermore, the 20-day moving average and even more so the 50-day moving average have played a major role in supporting the indexes whenever any selling does come in. Now we have had a couple days here in August where it looked like these support lines would be breached and in fact in some instances they were. However, whenever these support lines were touched or breached, buying came right in and placed a floor beneath the selling pressure.

I am not sure how the rest of the month will play out but August at least from a seasonality perspective still has the potential to demonstrate volatility and experience meaningful selling pressure. I really do believe that the bear camp expected to see August as their month, but from the looks of things the bears may have to wait until September or beyond. Corporate earnings for the most part have been topping expectations, the economy is seemingly firing on all cylinders and rising interest rates are not that big of a factor yet to be weighing heavily on stocks.

My plan for the rest of the month is simple. Pay attention to the support and resistance zones of the aforementioned indexes and for that matter any stock that I am considering to trade. Secondly, I need to see the trading volume pick up before any definitive trend can be trusted. The market volume just has not been here this month which is also typical of the dog days of summer. Patience is the keyword between now and month end. That said, I expect after the labor day holiday we will be having a much different conversation. Good luck to all 🙂

~George

Russell 2000 - Paula Mahfouz

Within Striking Distance!

In my previous blog, I said I wouldn’t be at the very least surprised if the Dow Jones Industrial Average (see chart below) closed above 25000 by year end. Well don’t look now, we are in striking distance of that milestone. In fact, if the Dow does close above 25000 by year end, it would have taken it a month to do so. That’s right only a month! In late November the Dow closed above the 24000 mark for the very first time and now its a mere 350 points away from yet another 1000 point gain. What’s impressive about this 1000 point clip is how fast it is getting there, I mean a month? This is unprecedented for sure. Market observers are expecting this insatiable bull market to keep on truckin into the end of the year, especially if the tax bill goes live! The S&P 500 (chart) and the Nasdaq Composite (chart) also closed at records highs on Friday with the S&P 500 closing in on the 2700 mark and the Nasdaq approaching the 7000 mark. The small-cap Russell 2000 (chart) is lagging behind but on Friday the Russell did find support at its 200-day moving average to close higher on the week.

With only 2 weeks left in the trading year what can investors or traders expect? More of the same or a sell the news type event? The news being the proposed tax bill getting through and going live. I truly don’t know? However, when you add seasonality into the mix with December being one of the strongest months for stocks on the year, I would not be surprised if the Dow Jones Industrial Average does indeed eclipse the 25000 mark. We could also see the S&P 500 overtake 2700 and the Nasdaq surpass 7000. Now if there is a snag in getting the tax bill through or if it ends up being a “sell the news” type of event meaning the proposed tax bill does go through by year end, then I will have a much different take heading into the new year. Both Paula and I wish everyone the healthiest and happiest holiday season 🙂

~George

Dow Jones Industrial Average - Paula Mahfouz