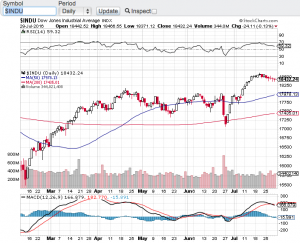
1000 Points In 7 Trading Days?

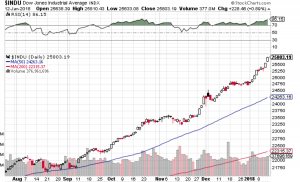
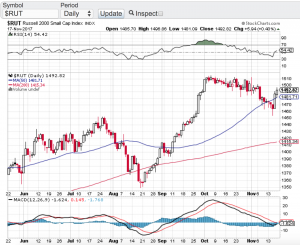
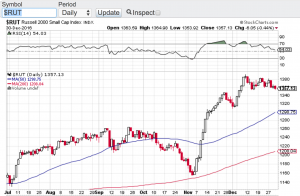
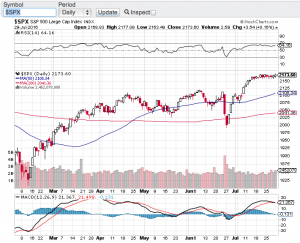
I am not even sure what to say here, almost 1000 points in 7 trading days? After closing above the 25,000 mark for the first time ever on January 4th, the Dow Jones Industrial Average (see chart below) is now closing in on the 26,000 mark in a matter of days. I simply do not understand how this bellwether index can notch 1000 point gains in such a short period of time. In fact most of the major averages are continuing to set records almost daily. How long can this go on? Without question we are on the brink of the strongest bull market in recorded history. The Dow Jones Industrial Average (chart) closed the week at a record 25,803.19, the S&P 500 (chart) closed at a record 2,786.24, the Nasdaq Composite (chart) closed at a record high of 7,261 and the small-cap Russell 2000 (chart) closed the record setting week at 1,591.90. The market was boosted on Friday in part by the strong quarterly earnings results of JP Morgan Chase.

Speaking of earnings reporting season, this week truly is the start of earnings reporting season in which most analysts expect strong top and bottom line growth from corporate America. Over the past few years the markets did witness strong bottom line growth in which a lot of that growth was due to improved efficiencies and reductions of the workforce. Now the opposite is occurring. The economy is expanding as is the job market. This should bode well for not only company earnings but for the continuation of the bull market. That said, I would think that a pullback of any kind is in the cards and I would also expect that investors and traders would be there in support of a retracement.

From a technical point of view equites are clearly overbought according to the relative strength index also referred to as the RSIHowever, this favorite technical indicator has not provided the guidance and reliability as it usually does simply because these markets have remained overbought for one of the longest stretches I can remember. There will be a time where the RSI will become more reliable as it once was, but in my humble opinion you will need a “normal” market environment for this to be the case. Good luck to all 🙂

~George

dow jones - george mahfouz jr

Tis The Season…

As the holiday season fast approaches stocks have a lot to be jolly for. Despite the recent pop in volatility, the major averages continue to enjoy their record setting ways. The Dow Jones Industrial Average (chart) closed the week at 23,258, the S&P 500 (chart) finished the week at 2,579, the tech focused Nasdaq composite (chart) closed at 6,783 and the small-cap Russell 2000 (see chart below) ended the week at 1,493 while recapturing its 50-day moving average.

Next week is a shortened trading week due to Thanksgiving. Historically the Thanksgiving holiday week tends to be a bullish week for equities with 75 percent of the time the markets finish higher. Add the seasonality factor into the mix and things look pretty good between now and year end. This doesn’t mean that things won’t be choppy along the way especially as the yield curve has many investors paying closer attention to it. Interest rate chatter is seemingly picking up lately despite the Federal Reserve being candid about their position and intentions. This will become further apparent when Fed chair Yellen speaks next week along with the release of the minutes from the last Federal Reserve meeting. All in all it appears that the status quo should be in place between now and year and if this is the case, new market highs should be set.

Earlier I spoke to how the small-cap Russell 2000 ( see chart below) has recaptured its 50-day moving average. This is important from the standpoint that investors and traders alike look to the Russell as a key indicator to the overall health of the broader markets. Recently the Russell has been showing some cracks in its trading patterns including noticeably breaking its 50-day only to recapture it and hold above it a few days later. If you are long this market, this is a bullish sign. That said, I do expect volatility to be present between now and year with the potential of making new highs along the way.

Paula and I wish everyone a very safe and Happy Thanksgiving 🙂

~George

Russell 2000 Paula Mahfouz

Dow 22,000 In Sight…

The Dow Jones Industrial Average (chart) closed the month of July at a record high and came within 70 points of the 22,000 mark. Just a few short months ago that the Dow surpassed the 21,000 milestone. What an incredible run in such a short period of time! Not only is the Dow Jones Industrial Average (chart) notching new record highs almost daily, the Nasdaq (chart) last Thursday posted a new record at 6460, as did the S&P 500 (chart) setting a new record of 2484. Last but not least, the small-cap Russell 2000 (chart) also set a new record last week of 1452. However, both the Nasdaq (chart) and the small-cap Russell 2000 (chart) have reversed their upward trajectory over the last few trading sessions in a noticeable manner. Let’s keep an eye on this development.

I think it is safe to say that Q2 earnings reporting season has helped fuel the Dow Jones to new record highs as well as the S&P 500. Tech stocks have been reporting a mixed bag so far this earnings reporting season which is why that index has started to abate a bit. All eyes today are on Apple (NasdaqGS: AAPL) which report their earnings results after the close. This could be the one stock that either reverses the latest mini-downward trend in the Nasdaq or for that matter, accelerate it. As I look to the technical shape of the the aforementioned indexes, only the Dow Jones Industrial Average (chart) is on overbought territory, while the S&P 500 (chart), Nasdaq (chart) and the small-cap Russell 2000 (chart) have begun their reversion to the mean and are all approaching the 50 value level of the relative strength index.

Game plan for August? Personally, I think it is time to reduce long exposure to equities due in part to this startling run stocks have had all year long. This coupled with the month of August being an historically weak month for equities could create the perfect set up for the much anticipated market correction that the bears have been waiting on. That said, I have to remind myself that there has been no such thing as typical in these markets for we have been in unchartered territory for a long period of time. One final note, it is always recommended to consult with a certified financial planner before making any adjustments to your portfolio.

Good luck to all 🙂

~George


Geopolitical Risks Abound…

Stocks closed the shortened holiday week down on Thursday as the U.S. dropped the largest non-nuclear bomb on a target in Afghanistan. This just after the U.S. launched tomahawk missiles targeting a Syrian airbase in response to a chemical attack on innocent civilians in Syria. Now North Korea is increasing its verbal threats of an all out war on the United States. What’s going on here? It’s hard to talk about stocks when all of this hatred is occurring around the world. Nonetheless, the markets will move forward but will be certainly affected by the troubling geopolitical environment and the uncertainties that exist in multiple regions around the globe.

For the week, the Dow Jones Industrial Average (chart) closed down 1%, the S&P 500 (chart) closed off 1.19%, the Nasdaq (chart) -1.2% and the small-cap Russell 2000 (chart) finished the week lower by 1.39%. Gold (see chart below) was up on the week and for the first time since November of last year, closed above its 200-day moving average. This is no surprise due to what is currently going on in the world. The question now is how to trade this market environment or what to do with your current positions? If history repeats itself, market volatility should increase which is good for traders but can be unnerving to longer term investors. In fact volatility (chart) spiked this week to its highest level in 5 months.

Now that earnings reporting season is underway some market pundits are saying that this will dictate whether or not markets will continue higher or if earnings reporting season will be the catalyst to send stocks into correction mode. I disagree with this point of view. How can the markets concentrate on earnings reporting season when you have this widespread turmoil around the globe? Of course, earnings are what typically drive stocks and valuations but until the geopolitical back drop abates and a sense of resolve comes forward I will be ultra conservative in going long any equities unless it is gold or gold related assets. Of course it is always best to consult a certified financial planner(s) before making any investment decisions. Good luck to all and both Paula and I wish all a safe and Happy Easter weekend.

~George

gold chart george mahfouz jr

Happy New Year!

Happy New Year to all and what a year of celebration for the bulls in 2016. The major averages last year notched very impressive gains. The Dow Jones Industrial Average (see chart below) finished the year up 2,337 points or 13.42%, the tech focused Nasdaq (click here for chart) closed up on the year 376 points or 7.5%, the S&P 500 (click here for chart) closed up 194 points or 9.54% and the small-cap Russell 2000 (see chart below) finished out 2016 up a whopping 221 points or almost a 20% gain outperforming most benchmarks. This eye-popping rally really kicked into high gear after the stunning upset victory Donald Trump pulled off over Hillary Clinton in the presidential election. So that was last year, now let’s take a look at 2017 and what lies ahead.

I begin with the obvious. Markets are certainly overbought and have been since the November 8th election results. Then in December, the Federal Reserve raised interest rates for the first time in a year and then added language for an additional rate hike in 2017 to bring the total projected rate hikes this year to at least three. Historically a rising interest rate environment puts pressure on equities and in particular the high beta names. Consensus has it that the Fed will move slowly to avoid any shocks to the economy or the markets. However, with Donald Trump’s proposed economic pro-growth policies, debt and inflation should rise. So I am sure the Federal Reserve will be keeping a close eye on how inflation ticks up as 2017 unfolds. Should inflation rise faster than anticipated this too could be a challenge for the Fed and our stock market.

So based on our current market environment it is my view that volatility will not only pick up in January but the recipe described above signals potential elevated volatility throughout the year. We also will begin to hear from corporate America this month as we head into earnings reporting season. I would expect earnings from multi-national companies to be a bit challenged due to the continuing and significant strength that the U.S. dollar has been exhibiting. That said, there will be opportunities abound in this new year but I am preparing to embrace volatility and hedge my positions going forward. In my next blog I will talk about hedging strategies in order to offset the impact of potential increased vol. Until then, both Paula and I wish everyone the happiest and healthiest new year to all. 🙂

~George

Dow Jones chart Paula MahfouzRussell 2000 post george mahfouz jr


Is It Time For A Breather?

Stocks have been on a tear since the end of June with the key averages gaining close to 10% or more since coming off of their late June lows. That’s right double digit gains in a little over a month lead by the Nasdaq (chart) which is almost up 13%, followed by the small-cap Russell 2000 (chart) up 12.35% and both the S&P 500 (see chart below) and the Dow Jones Industrial Average (see chart below) closing up nearly 10% in that same time period. Part of the reason why the tech focused Nasdaq has led the charge is the stronger than expected and recently announced quarterly earnings results out of Amazon (NasdaqGS: AMZN) Apple (NasdaqGS: AAPL), Facebook (NasdaqGS: FB) and Google aka Alphabet (NasdaqGS: GOOGL).

So the question now is after such dramatic double digit gains in the aforementioned indices and in such a short period of time, is it time for a pause and/or a retracement? As you all know by now, the first thing that I look at when it comes to accelerated gains in any stock or index is the relative strength index also known as the RSI. The relative strength index is a technical indicator to determine overbought or oversold conditions, click here  for the complete definition. The RSI is also one of the favorite technical indicators used by market technicians, certain money managers and even select algorithms have the RSI programmed into their model. That said, the Nasdaq has now hit the 70 value level of the RSI which is an overbought level according to the RSI while the other key indices are not too far behind. Please note that indexes and stocks can remain overbought for extended periods of time.

So what does all of this mean? Well I think the set-up now is a little spooky. Not only are we at or approaching overbought conditions according to the relative strength index, but we now find ourselves in the month of August. August historically tends to be one of weakest month of the year for equities. In fact, over the past seven years the key indexes have fallen each year during this time period. History doesn’t always have to repeat itself, but the current set-up bodes well for a softer month ahead. We will see. Good luck to all 🙂

~George

S&P 500 George Mahfouz Jr

Dow Jones Chart George Mahfouz Jr

A Respite From The Sell-Off!

Stocks snapped back sharply on Friday after a week of relentless selling pressure. On Friday the Dow Jones Industrial Average (chart), surged 313.66 points, the Nasdaq (chart) popped 70.67 points, the S&P 500 (chart) notched a gain of 35.70 points and the small-cap Russell 2000 (chart) closed Friday out up 18.27 points. For most of last week the markets were under tremendous pressure as oil continued to plummet along with bank stocks. On Thursday U.S. crude oil closed at a 13-year low only to snap back on Friday gaining over 12%. One of the reasons why oil has bounced off of multi-year lows is a rumor was floating around that the Organization of Petroleum Exporting Countries aka O.P.E.C. was prepared to cut production. We will see if this becomes the case. Furthermore, the European banks have been sold off ruthlessly all year long which has indeed carried over to our banks here at home. So when you have both oil and banks selling off the way that they have, it’s no wonder why there has been a global sell-off sending markets into correction territory.

As the global sell-off continues and as the chatter of doomsday gets louder and louder, I think it is important to remember that we have been in one of the strongest and longest bull markets of all time. Let’s not forget it is not only normal but quite healthy that stocks, bonds and commodities correct and balance out. It amazes me that when sell-offs occur that lead to corrections in the marketplace how the pundits come out of the woodwork and speak to how the world is coming to an end. My friends, what hasn’t been normal is for over six years how we have not had a market correction of over 10% that has stuck. Well here we are today and this is where we find ourselves.

Yes, equities can go lower and yes it can get more painful. But once valuations become attractive again and this is what market corrections provide, you better believe at some point in time buyers will resurface and take advantage of the what goes on sale. The markets are closed on Monday due to Presidents’ Day. Both Paula and I wish everyone a very safe and happy holiday 🙂

~George


Happy New Year!

2015 essentially proved to be a flat to down year for stocks taking some investors and traders by surprise. The Dow Jones Industrial Average (chart) closed the year down 2.2%, the S&P 500 (chart) minus dividends closed down just under 1%, the Nasdaq (chart) closed up 5.73% and the small-cap Russell 2000 (chart) closed the year down 5.71%. What’s more is how crude oil (chart) fared in 2015 declining more than 30% which also had weighed heavily on the aforementioned indices.

Looking ahead to this year, stocks find themselves in a place where they haven’t been in quite sometime and that is a rising interest rate environment. Historically speaking, equities tend to be under pressure at the beginning of and throughout a rate hike cycle with the exception of cyclical stocks and certain commodities. However this time may be different. In the past when the Federal Reserve begins to raise interest rates it is usually to fend off inflation and/or to cool off the economy when it becomes too hot. From my view and from the data flow, this is not the environment we find ourselves in today. So I do not expect that the Federal Reserve would raise rates aggressively or too quickly. With that said, the markets might not trade the way they would if we were in an inflationary environment with rising interest rates. Nonetheless, I do think that more volatility will come into stocks in 2016 and it will become more of a stock pickers market.

Furthermore, the technical shape of the market appears to be setting up for more downward movement as the key indexes have breached or are about to breach their respective 200-day moving averages. However, it would take days of trading below their 200-day to set off an alarm at least from a technical perspective. Let’s see how the first week of trading in the new year plays out before making any sort of definitive technical opinion.

Both Paula and I sincerely wish everyone the healthiest, happiest, safest and most prosperus New Year yet 🙂

~George

Finally The Bulls And Bears Got What They Wanted!

A Correction! After years of not having a 10% or more correction in the markets and with August tending to be one of the worst performing months for equities, this was the perfect set-up for the long overdue correction in stocks to take place. However, just as fast as the stock market correction occurred, the ensuing snap back rally was equally eye-poping. For the month, the Dow Jones Industrial Average (chart) fell 6.57%, the tech focused Nasdaq (chart) lost 6.86%, the S&P 500 (chart) -6.26% and in the month of August the small-cap Russell 2000 (chart) experienced a 6.45% decline. Last week we did witness very rare market behavior with whipsaw action not seen since the 2008 financial market crisis. This brought back memories of how stocks and financial markets can irrationally behave as emotions and high frequency trading take over.

The question now is, is this type of market volatility over? I don’t think so. Let’s first take a gander of the technical health of the four major averages. Without question, short term technical damage in these key indices have occurred. Each one of the index have fallen sharply and have closed below their respective 200-day moving averages. Furthermore, today at the open and for the first time in years, the S&P 500 (chart) will have its 50-day moving average crossover its 200-day moving average. Technically and historically speaking, this is not usually a good thing. The Dow Jones Industrial Average (chart) saw its 50-day crossover its 200-day in the middle of August only to experience exhaustive selling thereafter. The good news technically is that stocks had been way oversold to the point 0f capitulation. Hence, the ensuing sharp rally from the most recent lows.

So where do we go from here? I suspect that we will continue to experience outsized market moves in both directions and trading this kind of market environment is not for the feint of heart. I revert back to a more conservative approach starting with identifying the most current “best of breed” in their respective industries. The first prerequisite for me in identifying potential investment candidates in this type of market environment is for companies to have pristine balance sheets with little to no debt levels. However, if they do have debt they must have have historic and current cash flows that can easily service their debt. Without this and in today’s market I have no interest on really owning anything. Of course there are many other metrics that do apply but for me personally the balance sheet is where it begins. Another huge factor for me especially today is to implement disciplined  “protective stops” in any positions I hold. This ensures that your portfolio is somewhat protected should the markets decide that we are in the early innings of this correction. With that said and especially in today’s market, please consider consulting with a trusted certified financial planner(s) before making any additions or modifications to your own portfolio.

Both Paula and I wish everyone a very safe and Happy Labor Day holiday weekend 🙂

~George


Interest Rate Hike Fears Spook Stocks…

Since the release of the February labor market report, which was much stronger than the street expected, stocks have been on a wild ride. Triple digits gains and losses have occurred this past week with the Dow Jones Industrial Average (chart) In addition, the S&P 500 (chart), the Nasdaq (chart) and the small-cap Russell 2000 (chart) have all pulled back noticeably since the February jobs report was issued. So wait a minute, a strong labor market is good for the economy, hence, good for stocks too right? Logically speaking yes, but as it pertains to the Federal Reserve, a stronger labor market and a stronger economy gives them the green light to begin to raise interest rates.

This is what is now permeating through the stock market. The concern is that the Federal Reserve has enough data to begin to change their stance on their multi-year accommodative financial policies, policies that have benefited equities since 2009. We may not have to wait too much longer to gauge the Fed’s stance as it prepares for next week’s Federal Open Market Committee meeting. I think the anxiety we are witnessing may be a little exaggerated. It’s normal to have emotions play out and even take control over investors, however, people seem to forget that the Fed has been extremely cautious as to even eking out the wrong language in their official policy statements. I would not expect the Fed to shock the markets by raising rates too early or too aggressively. That said, I do expect volatility to continue and for markets to get “emotionally” charged. We could very well be in the midst of yet another dip back to the 200-day moving averages of the aforementioned key indices and should that occur, I would expect that buyers would come in bargain hunting. Over the past few years, the 200-day moving average has acted as significant support for these key indexes. The only difference and question now would be, is if the Federal Reserve indeed changes their position on interest rates, how well would this favorite technical indicator fare? Good luck to all and have a great week 🙂

~George