New Variant Spooks Markets…

A new Covid variant has spooked the markets enough to spike the VIX almost 50% (see chart here). The VIX aka the fear index took off on Friday after news out of South Africa that a new variant has emerged. The CBOE volatility index is a measure of price action in the S&P 500 options chain over the next 30 days. Investors and institutional investors alike pay attention to how investor sentiment is going at any point in time through the CBOE vol index. Historically when the markets are at work with no real headwinds or threats, the VIX in the 10-15 value range. Yesterday the VIX closed north of 27. No question over the past few days the VIX is revealing a bit of investor anxiety.

So now the question becomes is this a short-lived dynamic or is there more selling pressure in the offing? My feelings are this is a normal knee jerk reaction to yet another potential obstacle our economy and markets face. From what I have read we are weeks away to understanding the severity of this new variant or lack thereof. In the meantime, I think patience is key and to not act in haste. For all we know the vaccines could protect the population from this latest variant and if so, the markets could snap right back. However, if this becomes as severe and contagious as the Delta variant, then there is a strong chance the markets would continue to adjust accordingly.

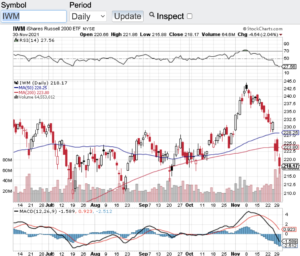
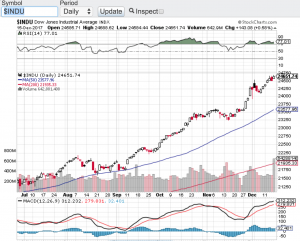
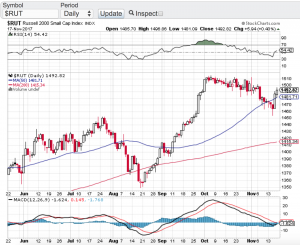
Let’s look at the technical backdrop of the major averages starting with the Dow Jones Industrial Average (see chart here). The Dow sold off over 650 points yesterday to close just above its 200-day moving average. The S&P 500 (see chart here) closed lower by 88 points approaching its 100-day moving average. The Nasdaq Composite (see chart here) closed the month of November down 245 points while breaching its 20-day moving average. Last but not least, the small-cap Russell 2000 (see chart below) closed down sharply as well yesterday, however, technically the Russell broke its 100 and 200-day moving averages in a meaningful way which does not bode well for this particular index as we enter the last month of the year.

One final note, no matter what happens in the market here in the short term, please take care of yourselves and your loved ones. We are approaching the two-year mark of this pandemic and everyone should take this serious, put the politics and conspiracy theories away and come together once and for all.

Wishing everyone a safe and healthy holiday season 🙂

~George

New Variant Spooks Markets - Paula Mahfouz

Within Striking Distance!

In my previous blog, I said I wouldn’t be at the very least surprised if the Dow Jones Industrial Average (see chart below) closed above 25000 by year end. Well don’t look now, we are in striking distance of that milestone. In fact, if the Dow does close above 25000 by year end, it would have taken it a month to do so. That’s right only a month! In late November the Dow closed above the 24000 mark for the very first time and now its a mere 350 points away from yet another 1000 point gain. What’s impressive about this 1000 point clip is how fast it is getting there, I mean a month? This is unprecedented for sure. Market observers are expecting this insatiable bull market to keep on truckin into the end of the year, especially if the tax bill goes live! The S&P 500 (chart) and the Nasdaq Composite (chart) also closed at records highs on Friday with the S&P 500 closing in on the 2700 mark and the Nasdaq approaching the 7000 mark. The small-cap Russell 2000 (chart) is lagging behind but on Friday the Russell did find support at its 200-day moving average to close higher on the week.

With only 2 weeks left in the trading year what can investors or traders expect? More of the same or a sell the news type event? The news being the proposed tax bill getting through and going live. I truly don’t know? However, when you add seasonality into the mix with December being one of the strongest months for stocks on the year, I would not be surprised if the Dow Jones Industrial Average does indeed eclipse the 25000 mark. We could also see the S&P 500 overtake 2700 and the Nasdaq surpass 7000. Now if there is a snag in getting the tax bill through or if it ends up being a “sell the news” type of event meaning the proposed tax bill does go through by year end, then I will have a much different take heading into the new year. Both Paula and I wish everyone the healthiest and happiest holiday season 🙂

~George

Dow Jones Industrial Average - Paula Mahfouz

Tis The Season…

As the holiday season fast approaches stocks have a lot to be jolly for. Despite the recent pop in volatility, the major averages continue to enjoy their record setting ways. The Dow Jones Industrial Average (chart) closed the week at 23,258, the S&P 500 (chart) finished the week at 2,579, the tech focused Nasdaq composite (chart) closed at 6,783 and the small-cap Russell 2000 (see chart below) ended the week at 1,493 while recapturing its 50-day moving average.

Next week is a shortened trading week due to Thanksgiving. Historically the Thanksgiving holiday week tends to be a bullish week for equities with 75 percent of the time the markets finish higher. Add the seasonality factor into the mix and things look pretty good between now and year end. This doesn’t mean that things won’t be choppy along the way especially as the yield curve has many investors paying closer attention to it. Interest rate chatter is seemingly picking up lately despite the Federal Reserve being candid about their position and intentions. This will become further apparent when Fed chair Yellen speaks next week along with the release of the minutes from the last Federal Reserve meeting. All in all it appears that the status quo should be in place between now and year and if this is the case, new market highs should be set.

Earlier I spoke to how the small-cap Russell 2000 ( see chart below) has recaptured its 50-day moving average. This is important from the standpoint that investors and traders alike look to the Russell as a key indicator to the overall health of the broader markets. Recently the Russell has been showing some cracks in its trading patterns including noticeably breaking its 50-day only to recapture it and hold above it a few days later. If you are long this market, this is a bullish sign. That said, I do expect volatility to be present between now and year with the potential of making new highs along the way.

Paula and I wish everyone a very safe and Happy Thanksgiving 🙂

~George

Russell 2000 Paula Mahfouz