Big Tech Blowout!

Big tech steals the show with blowout earnings results. Apple (NasdaqGS: AAPL), Amazon (NasdaqGS: AMZN) and Facebook (NasdaqGS: FB) all took the street by surprise with their upside earnings reports. For Apple, in addition to their blowout earnings, the company announced a 4-1stock split. This was more than enough for Apple to close up over 10% yesterday at an all time high of $425.04. Apple’s earnings came in over $2.00 per share on revenues just shy of $60 billion. Stunning numbers considering the backdrop that our country is currently in. When I look at what Amazon did, I am equally if not more impressed especially with how they grew their revenues. It’s hard to believe a company of this size grew their revenues 40% to almost $90 billion on the quarter. Without question Amazon has benefited more than any other company due to the pandemic. Consumers have flocked to online shopping more now than ever. Last but not least, let’s look at what Facebook did. Despite experiencing ad boycotts by some of the biggest brands in the world, Facebook managed to grow ad revenues by over 10% and grew earnings by almost 100%. I don’t think anyone expected these type of quarterly results from this group with all things considered.

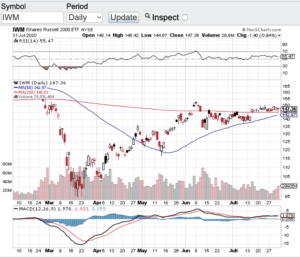
Let’s take a gander at the major averages and how they are looking from a technical standpoint. The Dow Jones Industrial Average (see chart here) closed the week at 26428.32. When I look at the chart of the Dow, this index is not overbought according to the (RSI) and the Dow closed right around its 20-day and 200-day moving averages. The S&P 500 (see chart here) closed at 3271.12 and this index bounced off of its 20-day moving average with perfection. The Nasdaq Composite (see chart here) has been the big winner so far this year and technically speaking this index could potentially keep running. Heck, i’d be ok if it paused and consolidated a bit because of the run its been on. The other index that I keep an eye on is the small-cap Russell 2000 (see chart below). Speaking of consolidation, that is what appears to be happening with the Russell 2000. This index has been trading sideways for the past week or so and is trading consistently above its 20 and 200-day moving averages during this consolidation period. So all in all the aforementioned indexes appear to be on solid ground from a technical analysis standpoint.

In closing, despite the current shape of the market, the month of August historically tends to be a volatile month. Couple this with the upcoming Presidential election and we could be in for a wild ride between now and election day.

Good luck to all 🙂

~George
Big Tech Blowout - Paula Mahfouz

A Week To Forget…

Certainly, a week to forget! Not since the depths of the 2008 financial crisis have we seen volatility so high (see chart here) as stocks and indexes react to the spread of the coronavirus. Last week, the Dow Jones Industrial Average (see chart here) saw multi-thousand point swings. The S&P 500 (see chart here) was not spared from the highest volatility in a decade. The Nasdaq Composite (see chart here) and the small-cap Russell 2000 (see chart here) both experienced eye-popping swings as well. However, on Friday the President declared a national emergency and he announced a $50B relief package to combat the coronavirus. Stocks took that cue and had one of their best day’s ever with the Dow Jones Industrial Average (chart) soaring almost 2000 points, the S&P 500 (chart), the Nasdaq Composite (chart) and the Russell 2000 (chart) all gaining almost 10% on the day.

Now we find ourselves in a highly volatile environment that in my opinion won’t abate until more metrics come forward pertaining to the spread here in the U.S. and the plans to contain it. The administration took a huge step yesterday by declaring a national emergency and to promise the full resources of the government to combat and control this virus. Furthermore, the government is waiving interest rates on student loans and committed to buying oil from U.S. companies to “fill up our strategic reserves”. It’s no wonder stocks had one of their best days in history.

I always like to conclude my blogs with a take on the technical shape of the key indexes. Needless to say there was a lot of technical damage done last week pertaining to technical makeup over the markets and in particular the moving averages. All of the major indices broke their respective 20-day, 100 and 200-day moving averages. These are all significant support zones that have been broken through. The one bright spot in this dynamic is the selling was so severe that after the dust settles strong rallies can and do typically occur as we witnessed on Friday. We are also now way below the key moving averages that often times the markets go back to retest those averages. If this does occur the set-up is very promising for bargain hunters. That said, I am not suggesting that the markets will rip roar back anytime soon, but historically strong rallies do occur after panic selloffs.

Good luck to all 🙂

~George

Is More Volatility Ahead?

The month of August proved to be one of the more volatile months so far this year. The question now is will this volatility continue here in September? As long as the turbulent tweets continue out of Washington, I bet the vol we witnessed in August will indeed continue this month. Markets hate uncertainty and as long as our President continues to flip flop seemingly daily and then tweet about it, we could very well be in for more vol. It’s not rocket science, when the tweets are positive and have consistency, stocks go green. Then when the flip flopping occurs they go red. It is amazing to me how stocks react to every single tweet or flip out of Washington. Sure there are algorithms that are programmed to react to headlines, but because of the constant noise out of Washington it’s no wonder we have been whipsawing around.

I always try to tune out the noise and focus on the fundamentals and technical shape of the markets. Let’s take a look at the current price to earnings ratio (click here) of the S&P 500. The S&P 500 (see chart here) price to earnings ratio continues to trade above historic norms. Despite all of the current uncertainties especially with the trade war, stocks on average are still trading above the 20 PE ratio level. The historic price to earnings average for the S&P 500 is somewhere in the mid-teens. So from a fundamental valuation standpoint the markets remain at the upper end of the channel. There are many other valuation metrics and government policies that play into the valuation analysis mix, but purely from a price to earnings ratio, one can ascertain that we remain a bit overpriced.

That said, companies can certainly grow into their current valuations but we definitely need to get the trade war with China resolved so that companies know where they stand. Both Paula and I wish everyone a very happy and safe Labor Day weekend 🙂

~George


Is It Time To Hedge?

As we remain in one of the strongest bull markets ever, is it time to hedge? Whoever has tried to short the market this year or for that matter the last nine years understands this has not been an effective strategy to say the least. However, as we are now entering the height Q3 earnings reporting season and as I mentioned in my previous blog implementing a hedge strategy could provide continuing beta should the bull market carry on yet offer profits in the event stocks or indexes go down. The strategy I am referring to is an options strategy called a “straddle”. A straddle is when an investor buys a call and a put option with the same strike price and expiration date with the selected strike price as close as possible to the current stock price of the underlying asset. Let’s take Intel as an example: Intel (NasdaqGS: INTC) closed on Friday at $39.67 and is scheduled report their earnings results on October 25th. Taking a look at the November $40 strike price on Intel, the call option is approximate $0.83 per contract and the put option is approximately $1.34 per contract. So if an investor/trader decides to put a straddle on Intel at this particular strike price, the total cost of the straddle is $2.17. You arrive at this number by simply adding up the cost of the put and call option. Where you profit from this trade is if Intel trades north or south of $40 by more than the total cost of the trade and before expiration.

One of the reasons why straddles can be effective during earnings reporting season is that earnings can be a huge catalyst for stock price movement. This especially rings true when a company surprises to the up or downside. With a straddle it does not matter which direction the underlying asset moves, so long at it moves greater than the total cost of the straddle. The risk with the straddle is if the underlying asset does not have a big move in either direction before the straddle expires. Options do have an expiration date so you have to make sure that the catalyst occurs before the expiration date and even then allow yourself time for the full potential to play out. I also look for the historic movement of a stock or index to see if it does move greater than the cost of any given straddle regardless of a “catalyst”. That said, options and options strategies are extremely risky and volatile and you should always consult with a certified financial planner before considering any new strategy. Good luck to all 🙂

~George

Back To Setting Records!

After a tumultuous and volatile month, stocks are back to their old habits. The Dow Jones Industrial Average (chart) and the S&P (chart) 500 both closed at record highs. The month of October also saw the Nasdaq (chart) finish up over 3% and the small-cap Russell 2000 (chart) closed the month out up an eye-popping 6.5%. So as far as the long awaited correction goes, lets take a look. The Dow (chart) from it’s previous all-time high corrected 8.61%, while the S&P 500 (chart) retraced 9.83% by mid-October. Not quite the text book healthy 10% correction most investors were looking for, but close enough. The question I have is, will this snap-back rally to new all-time highs hold? Earnings for the most part have been coming in pretty good, however I have not seen the robust top-line growth you would expect in order to keep setting new records. Nonetheless, easy global monetary policies continue to keep not only a floor under these markets, but provide enough juice to lift the markets to new highs. Just yesterday the Bank of Japan unexpectedly raised its bond buying program from JPY 70 trillion to 80 trillion and it also tripled its ETF buying to JPY 3 trillion. So as long as the federal reserves from around the world continue to increase their balance sheets, the bulls should have the upper hand.

The concern I have with the most recent market correction is that it didn’t last very long. It’s true that over the past five years most modest pullbacks immediately snapped back, just like this latest quasi-correction did. Personally, I would of liked the correction to last a little longer and go a little deeper for it feel like a meaningful correction. Because of the markets most recent snap back rally, all of the major averages are now fast approaching overbought conditions according the the Relative Strength Index (RSI). I truly think early next week will be the tell. If we continue to lift, then we will certainly breach the 70 value level of the RSI and enter into overbought territory and possibly remain overbought for the rest of the year. However, if the rally stalls, we could easily reverse and then who knows? Add the wildcard of mid-term elections this upcoming week into the mix, and most likely volatility comes back into the forefront. For me I am going to the sidelines until after the mid-term elections are over, and also to see if we stall here at record levels. Good luck to all and have a great weekend 🙂

~George


A week of respite for stocks…

Despite the Dow, Nasdaq, S&P 500 and the Russell all finishing lower on Friday, these key indices finally completed a week in positive territory. In fact, this is the first positive week for the bellwether indexes in the month of May. For the week, the Dow Jones Industrial Average (chart) closed up 0.69%, the Nasdaq (chart) +2.11%, the S&P 500 (chart) +1.74% and the Russell 2000 (chart) gained 2.57%.

Without question the markets last Monday experienced a technical bounce due to oversold conditions across the board. What was impressive to me is that equities for the most part managed to hold on to their gains. Not so sure if this will be the case this upcoming week. Between the never ending saga from across the pond and a slew of economic reports from here at home, next week is setting up to be to be a very volatile week. The most critical economic report that all will be watching is Friday’s jobs report. If we do not begin to see the private sector strengthen in a meaningful way, we could be in for a long summer and a possible new administration this fall. Good luck to all.

Have a safe and healthy Memorial Day weekend 🙂

~George