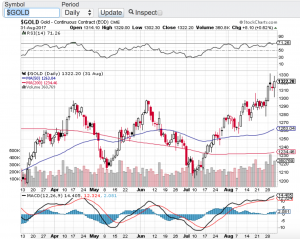
It certainly appears that way. Gold (see chart below) has caught a meaning bid as of late and it’s about time. The yellow medal has been stuck in a trading range between $1200 and $1300 per ounce for months and now has broke through the $1300 level currently trading around $1330 per ounce. What has surprised me is how long it took for gold to finally go from the left side of the chart to the right. Especially considering the geopolitical risk environment we find ourselves in. That said, stocks are saying what risk? As I write this blog, the Dow Jones Industrial Average (chart), the S&P 500 (chart), the Nasdaq (chart) and the small-cap Russell 2000 (chart) once again are all approaching all time highs. This after a very modest pullback in August. So Wall Street continues to remain in the “buy the dip” mood. All year long and every single time stocks experience any type of pullback, buyers come in and lift the markets to all time highs.
How long can this last? From a technical standpoint the key indices remain below the 70 value level of the relative strength index also referred to as the RSI. The RSI is used as a gauge by certain market technicians to see if whether or not stocks in the short term are overbought or oversold. As as these indexes approach all-time highs and should they breakthrough those highs, these markets can and should continue to go higher. However, if they do not breakout here, then one could expect yet another pullback especially as we are now in one of the more underperforming months for equites of the year. Historically September and October for that matter tends to be a difficult time for the markets. However, based on what we have witnessed all year long despite the ongoing geopolitical risks and with interest rates on the rise, the markets may not care about the seasonality trends of September and October. Good luck to all and both Paula and I wish everyone a safe and relaxing Labor Day Weekend 🙂
~George