The Bears Are Baffled!

What is historically one of the weakest months of the year for stocks, the S&P 500 (chart) closed the week and halfway point of the month at an all time high of 2500. The Dow Jones Industrial Average (chart) also closed the week at a record high, along with the tech-focused Nasdaq (chart) and last but not least, the small-cap Russell 2000 (chart) appears to be closing in on a new record high as well.

The bear camp has to be completely exhausted. I mean how in the world can you have the confidence to short this market? Not even the continuation of North Korea’s missile launches can slow down one of the most significant bull markets in history. Now seemingly we need to throw out all traditional metrics, seasonalities, geo-political risks, price to earnings ratios etc. This market has been immune to any risks. I have never seen anything like this. What’s more, there are survey’s out there that indicate that professional investors are the most pessimistic about the markets since before the election. You know what that means? Stocks tend to act the opposite of street sentiment.

Over the years and as most of you know one of my favorite technical indicators and one of the preferred technical indicators of money managers and institutional trader alike is the relative strength indicator. This indicator has been a trusted source to spot overbought and for that matter oversold conditions. The problem I have encountered this year is when indexes or individual equities have reached an overbought condition according to the RSI, the pullbacks that ensue have not provided the proper risk reward to any short thesis. The retracements are so shallow and short-lived that it is not worth putting the trade on. So needless to say, this strategy is on hold for now.

I am not sure what will be the catalyst for stocks or indexes to begin trading on pure fundamentals and not on the oversupply of liquidity and low interest rates. Until then, I will be very cautious in using the traditional metrics and/or technical indicators to base my decisions off of. Good luck to all 🙂

~George
Dow 21,000 Are You Kidding?

This market is unbelievable! As I am writing this blog the Dow Jones Industrial Average (chart) has eclipsed the 21,000 mark. This after President Donald Trump’s first speech to the joint session of Congress. Not only has the Dow breached 21,000, the Nasdaq (chart) has also set a new record this morning at 5,875, the S&P 500 (chart) has set a new record of 2,384 and counting, the small-cap Russell 2000 (chart) has hit a new record high and even the Dow Jones Transportation Average (chart) has set a new record high this morning at 9567.

It’s been exactly one month since the Dow Jones Industrial Average (chart) topped the 20,000 mark and now catapulting through 21,000! It’s inconceivable that the Dow has tacked on yet another 1,000 points in a month. The bears must be in shock! I am not exactly sure what President Trump said last night that is any different from what he has already promised during his campaign and during his inaugural speech in January. One would think that the markets have already priced in the “huge” corporate tax cuts Trump has promised. Also, I thought that the markets have also priced in the proposed $1 trillion dollar infrastructure spend. One thing for sure, right now the markets don’t care about valuations or the fact that it will take time for the Trump administration to figure out if the tax cuts or infrastructure spend as promised will even occur as designed?

I like to close my blogs out with the current technical take of the indexes. Quite honestly, the technicians are also baffled about this tape. The Dow Jones Industrial Average (chart) remains in extremely overbought conditions as does the S&P 500 (chart). The Nasdaq (chart) just re-entered overbought territory according to the relative strength index and the small-cap Russell 2000 (chart) is heading in that direction. We are witnessing one of the strongest bull markets in history!

Good luck to all 🙂

~George


OPEC Adds Fuel To The Rally!

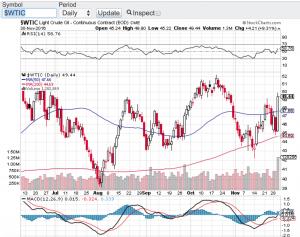
For the first time since 2008 the Organization of the Petroleum Exporting Countries (OPEC) agreed to cut output sending oil prices and oil stocks soaring. Oil (see chart below) had one of its best days in years soaring over 10% which helped propel the Dow Jones Industrial Average (chart) and the S&P 500 (chart) to set yet another record high yesterday before a late day sell-off. Nonetheless, stocks have been on fire since Donald Trump won the election. Seemingly every sector other than the gold sector is overbought. All you have to do is look at the financial sector Symbol: XLF (chart), the materials sector Symbol: XLB (chart), the industrials sector Symbol: XLI (chart) and the energy sector Symbol: XLE (chart) to see how overbought this market is. That said, stocks and or indexes can remain overbought or oversold for that matter for extended periods of time. Add into the mix Trump’s pledge to spend over $1 trillion on infrastructure here in the U.S. and the pledge to cut corporate and capital gains taxes and why would anyone think this rally could not continue?

It is easy to get caught up in the current euphoria of this breathtaking rally in the stock market and the promises of the incoming administration. However, let’s not forget what has been promised has to actually occur and if there is any back peddling by the new administration, the markets could react just as aggressively to the downside as they have to the upside. I am not suggesting that this will happen but we have all seen politicians make promises before they are elected only to change their tune after they take their respective seats. Which is why I do my best to tune out the noise and focus on overbought and oversold conditions. And this is where we find ourselves today. A very overbought market that I would expect will revert to the mean at some point in time.

Good luck to all 🙂

~George

oil chart George Mahfouz Jr