Breathtaking Volatility!
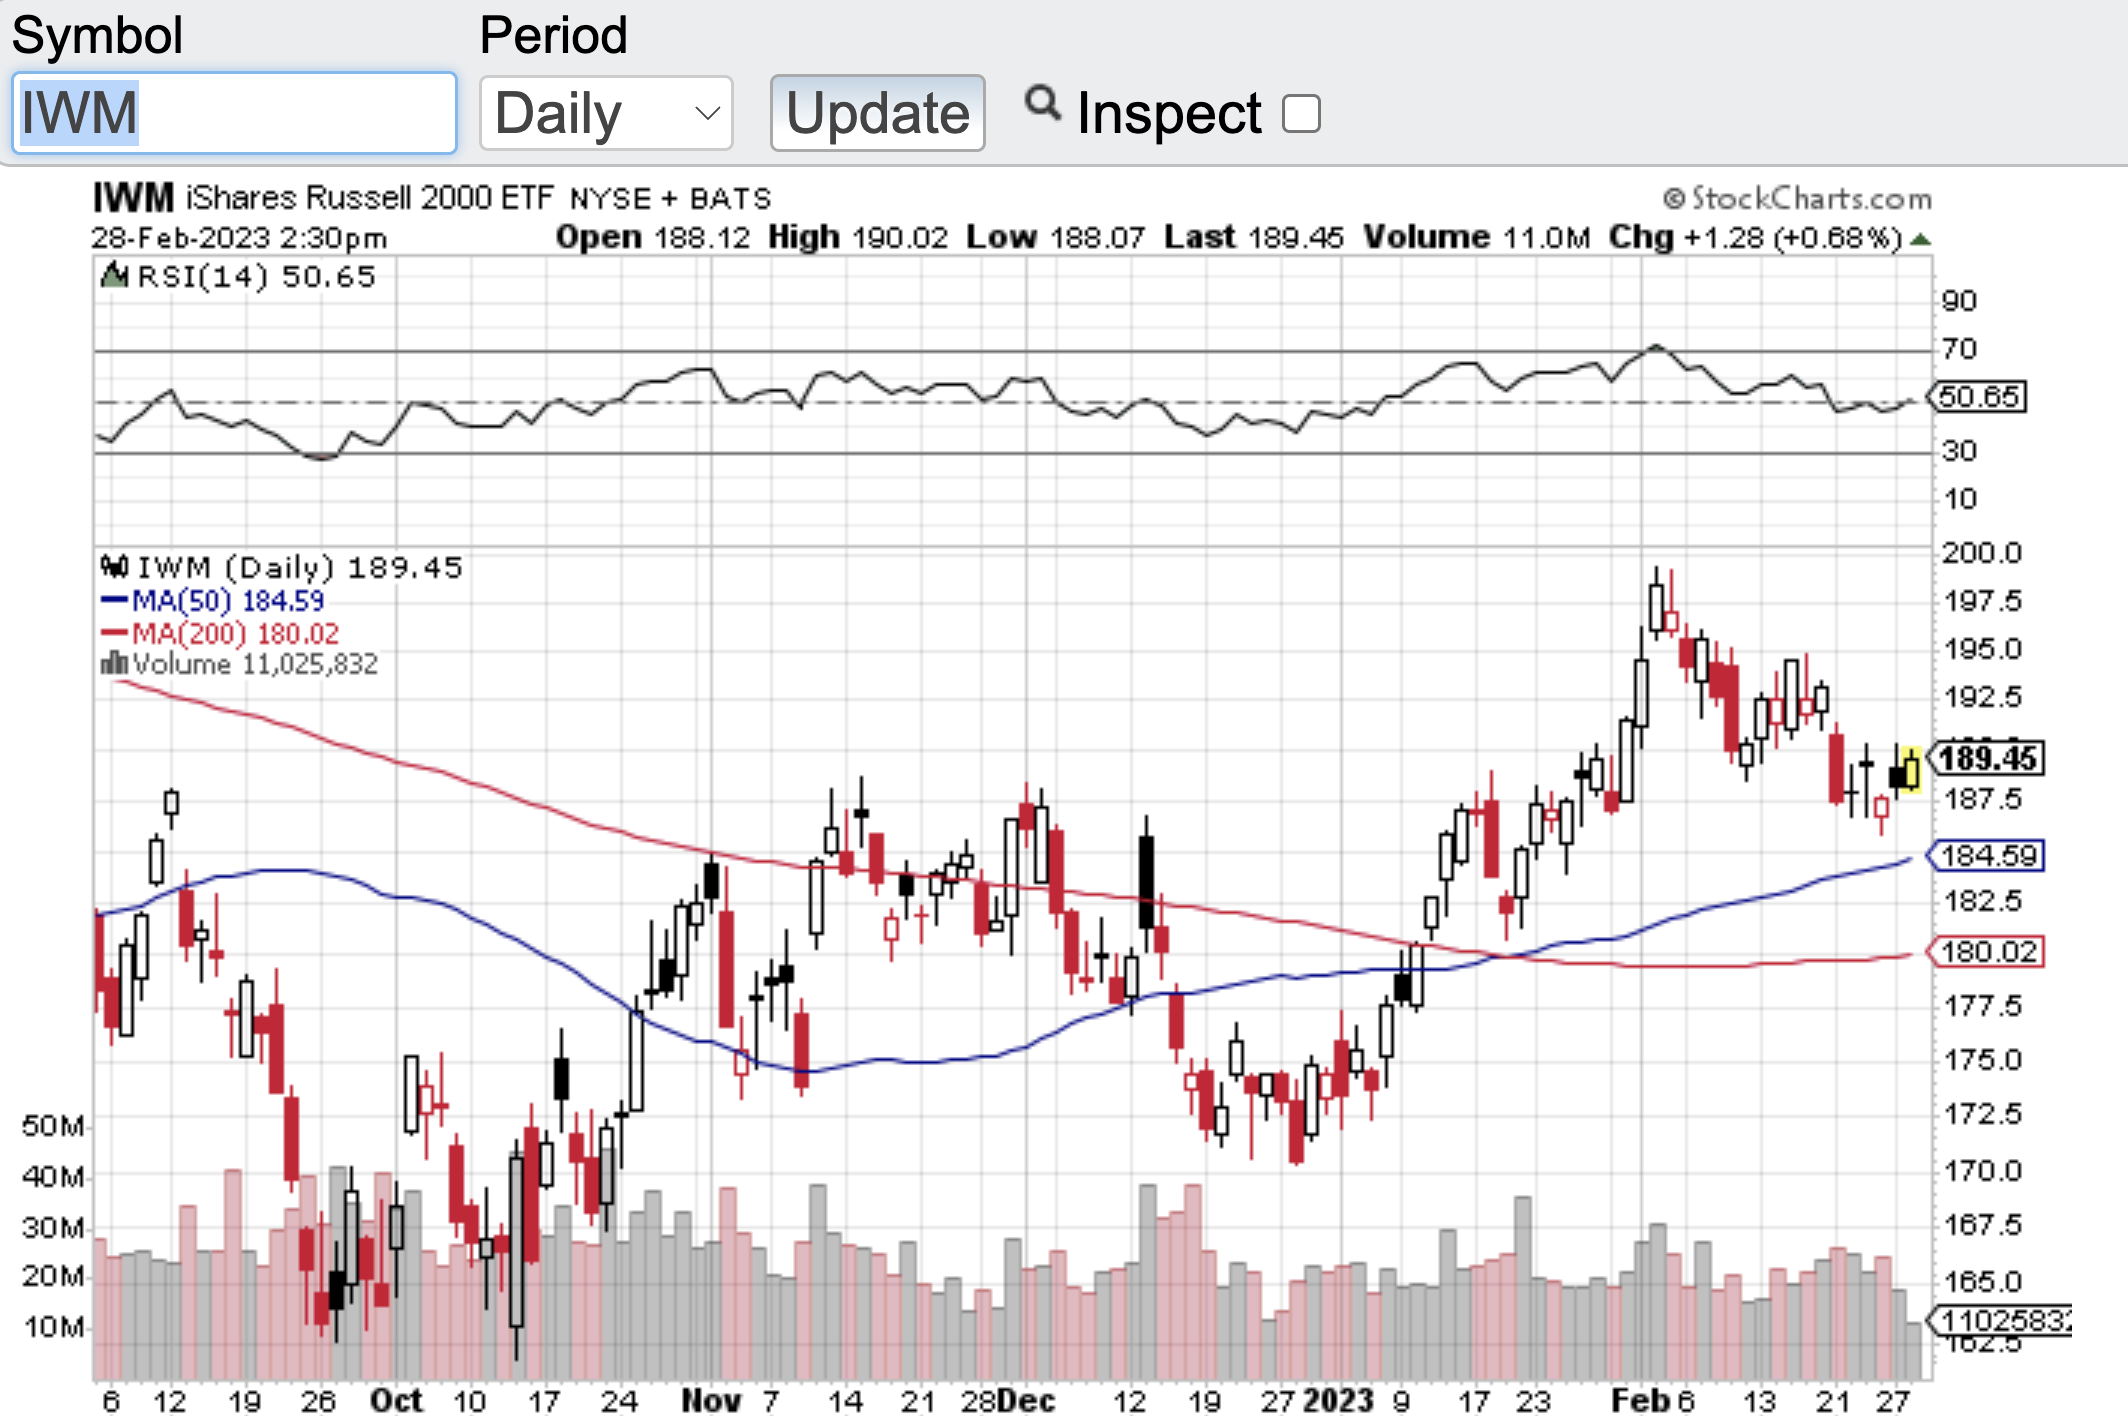
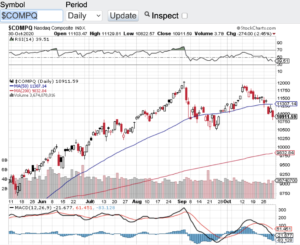
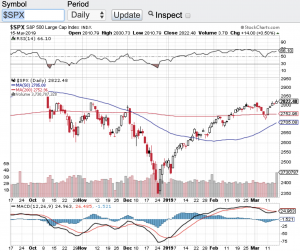
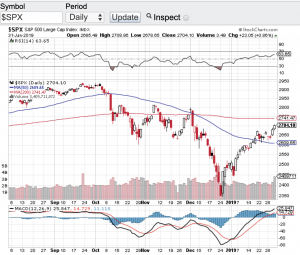
Breathtaking volatility has stormed the markets, especially since the war began. The currently vol has produced 1000 point swings in the Dow Jones Industrial Average (see chart here), this while the Nasdaq Composite soared over 750 points yesterday (see chart here). A 750-point day in the Nasdaq Composite is rare. The S&P 500 (see chart here) also has been whipped sawed as of late, while the small-cap Russell 2000 (see chart here) broke its 200-day moving average (click here) on Monday but reclaimed it the very next day. Remember the 200-day moving average is considered a major support line and no one who is long the market wants to see that support line fail.
In March, the key indexes also entered into correction territory by dropping over 10 percent from their all-time highs that were put in earlier in the year. A 10 percent drawdown is considered a “correction” while a 20 percent or more draw down is considered the beginning of a bear market. Luckily for the longs, the bleeding stopped in the 10 percent zone. So how did the selling pressure stop? The simple answer is our government came out and stated that they anticipate pulling out of the war in Iran in the next few weeks or so. Then after yesterday’s rally off the lows in the after-hours session the White House announced that the President is going to address the nation tonight regarding the war. This was enough for the rally to continue today as all the major averages added on to the gains made over the past two sessions.
So where do we go from here? I think a lot depends on what is said in tonight’s address to the nation and then how much investors believe what is said. In a geo-political crisis, investors and especially fund managers understand that things can change on a dime. What I hope for is concrete evidence that a cease fire will occur and that the healing can begin. In the meantime, I am remaining cautious until all the smoke clears.
Good luck to all 🙂
~George