Gold & Silver Stole The Show!
Despite the overall markets booking impressive gains in 2025, it was gold and silver that stole the show. Gold (see chart here) went up and eye-popping 65% last year, while silver (see chart here) booked an unbelievable 135% return in 2025. That’s right, 65% and 135% annual returns on these precious metals (click here) which also set all-time highs. This type of parabolic move in gold and silver has not been seen in decades.
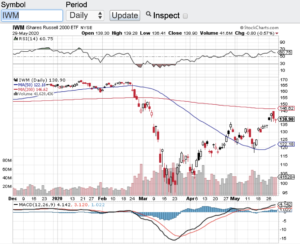
The overall markets also posted double digit gains with the Dow Jones Industrial Average (see chart here) gaining over 13% on the year, the S&P 500 (see chart here) booked a 16% plus gain, the Nasdaq Composite (see chart here) gained 20% and the small-cap Russell 2000 (see chart here) closed the year up 12%.
Needless the say the bulls were very happy with how the markets fared last year. As we head into the new year, I am looking for a similar backdrop at least at it pertains to the overall markets. In December, not only did the Federal Reserve cut interest rates they moved from quantitative tightening (QT) to quantitative easing (QE). This move essentially is going to flood the system with liquidity and capital flow that will move into the markets over the course of time. I know we are near or at record highs but there is an old saying on Wall Street and that is “don’t fight the Fed”. Meaning, when the Federal Reserve begins to implement accommodative policies such as moving from “QT” to “QE” markets typically respond favorably.
Make no mistake there are still risks out there from the geo-political backdrop to the instability out of Washington D.C. Without question when this volatility comes in and it will, the markets will act accordingly. So as much as this bull market can still run, I expect dramatic selloffs along the way.
Wishing everyone a safe and most prosperous New Year 🙂
~George