Cheers To The Markets!

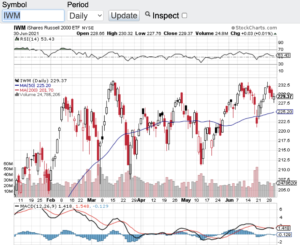
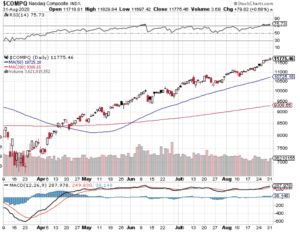
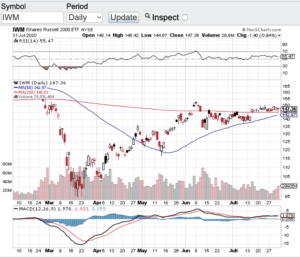
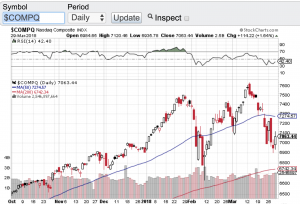
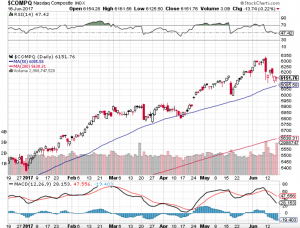
Cheers to the markets and what a year for stocks! 2023 turned out to be a spectacular year for the stock market as not many expected the markets to rip-roar as it did last year. The Dow Jones Industrial Average (see chart here) finished the year up almost 14 percent. The S&P 500 (see chart here) closed the year up 24%. The Nasdaq Composite (see chart here) closed the year up a whopping 44 percent. A big part of the Nasdaq’s eye-popping performance was how the “Magnificent 7” performed. For those of you who do not know who the Magnificent 7 are, it is the big tech group made up of Apple (NasdaqGS: AAPL), Microsoft (NasdaqGS: MSFT), Google owner Alphabet (NasdaqGS: GOOGL), Amazon (NasdaqGS: AMZN), Nvidia (NasdaqGS: NVDA) and Meta Platforms (NasdaqGS: META) and Tesla (NasdaqGS: TSLA). Finally, the small-cap Russell 2000 (see chart here) closed the year up 15%.

Many stock market experts did not expect such a stellar year for stocks. Let’s dig in and see what happened. For starters, inflation itself retreated faster than anyone expected which now has the Federal Reserve speaking to cutting rates in 2024. This metric alone is very bullish for stocks. Then factor in how strong the economy has been it’s no wonder we are at or near all-time highs. What’s equally impressive is how the markets have shrugged off the geopolitical backdrop. From two wars that seemingly have no end is sight, to the U.S. political divide, to China’s stagnant economy, nothing seems to be bothering the markets, at least not yet.

As we now look forward to 2024, I think we are in for a doozy of a year, at least from a volatility standpoint. We are also in an election year, and this alone should create higher volatility. I would also expect that after such a strong performance in 2023 that a pause and/or even a correction of some sort could potentially be in the cards for the markets in general.

Wishing everyone the healthiest, happiest, and most prosperous new year 🙂

~George

No June Swoon This Year…

No June swoon this year, these markets are simply not having it. June historically can be either a slow month or a month of selling pressure. Neither really happened this year. Despite a brief dip in the major averages a couple of weeks back due to inflation concerns, stocks and indexes held their own last month. The Dow Jones Industrial Average (see chart here) closed out the month at 34502, the S&P 500 (see chart here) finished the month just shy of 4400, the Nasdaq Composite (see chart here) closed out the month in record territory at 14503 and the small-cap Russell 2000 (see chart below) finished the month and first half of the year at 2310.

I remain in awe of the resiliency of stocks and most every other asset class out there. I read the other day that Facebook (NasdaqGS: FB) has become the fifth company in the United States to surpass the $1 trillion value mark. We now have in our country five companies that are valued at over $1 trillion dollars. Apple (NasdaqGS: AAPL), Amazon (NasdaqGS: AMZN), Microsoft (NasdaqGS: MSFT) and Alphabet aka Google (NasdaqGS: GOOGL) round out the top five trillion-dollar companies. When I see this type of action it makes me wonder how much earnings power do these companies need to continue to exhibit in order to keep their eye-popping valuations going? One other obvious similarity is the companies are all tech stocks and that is where the real growth has been. If you go back 20 years, I don’t think anyone would of expected five companies in our markets all reaching and boasting trillion dollar plus valuations. Heck, Microsoft’s market cap just surpassed $2 trillion dollars to join Apple as the only companies with more than a $2 trillion dollar valuation. Folks I am not a forensic analyst, but my goodness how is the law of large numbers playing a role here?

As I look at the technical shape of the major averages nothing really stands out to me with the exception of the Nasdaq Composite (see chart here). The Nasdaq has just entered overbought territory according to the relative strength index aka the RSI. The Nasdaq also just hit an all-time high so I think some sort of pullback could potentially be in the offing.

Have a safe and happy 4th of July weekend 🙂

~George

No June Swoon This Year - Paula Mahfouz


Are The Indexes Out Of Balance?

With how hot tech stocks have been lately, one has to ask are the key indexes out of balance? Let’s take a look. It is no secret tech stocks have been on fire, the Nasdaq Composite (see chart here) has been setting records weekly. Stocks like Tesla, Apple and Amazon continue to set all time highs. Price to earnings ratios aka the P/E ratio are also expanding to levels not seen since the tech bubble of the early 2000’s. I am not suggesting that tech as a whole is in a bubble, but there can be an argument that certain tech stocks are. I am not singling out Tesla at all, but what I am highlighting is the company’s eye-popping 1000 + P/E ratio. The price to earnings ratio is a metric for valuing a company that measures its current share price to its earnings per share. For example the S&P 500 typically trades in the 15-20 P/E range. Yes, a 15 to 20 P/E multiple is the historic price to earnings multiple that the S&P 500 trades at. So when you look at Tesla and see that this company’s P/E ratio is currently over 1000, it does bring pause and perspective into the mix.

Back to the indexes that appear to be out of balance. As the S&P 500 (see chart here) and the Nasdaq Composite (see chart below) continue to set records, the majority of stocks have not returned to their pre COVID highs and still remain down on the year. This to me is something to pay attention to. Sure, some tech stocks deserve their current valuations due to how they are growing and benefiting from the widespread lockdowns. Tech stocks and the technologies they provide are serving businesses and consumers alike in a way no one would of thought of before the pandemic took hold of our country. However, even stocks like Apple have high seen quite the expansion of its P/E multiple which is currently trading at 39. Bottom line for me, as we are setting records each week, I would prefer to see a broader base rally to ensure that we are not out of balance with each and every record that is being set.

Good luck to all 🙂

~George

Are The Indexes Out Of Balance? - Paula Mahfouz


Big Tech Blowout!

Big tech steals the show with blowout earnings results. Apple (NasdaqGS: AAPL), Amazon (NasdaqGS: AMZN) and Facebook (NasdaqGS: FB) all took the street by surprise with their upside earnings reports. For Apple, in addition to their blowout earnings, the company announced a 4-1stock split. This was more than enough for Apple to close up over 10% yesterday at an all time high of $425.04. Apple’s earnings came in over $2.00 per share on revenues just shy of $60 billion. Stunning numbers considering the backdrop that our country is currently in. When I look at what Amazon did, I am equally if not more impressed especially with how they grew their revenues. It’s hard to believe a company of this size grew their revenues 40% to almost $90 billion on the quarter. Without question Amazon has benefited more than any other company due to the pandemic. Consumers have flocked to online shopping more now than ever. Last but not least, let’s look at what Facebook did. Despite experiencing ad boycotts by some of the biggest brands in the world, Facebook managed to grow ad revenues by over 10% and grew earnings by almost 100%. I don’t think anyone expected these type of quarterly results from this group with all things considered.

Let’s take a gander at the major averages and how they are looking from a technical standpoint. The Dow Jones Industrial Average (see chart here) closed the week at 26428.32. When I look at the chart of the Dow, this index is not overbought according to the (RSI) and the Dow closed right around its 20-day and 200-day moving averages. The S&P 500 (see chart here) closed at 3271.12 and this index bounced off of its 20-day moving average with perfection. The Nasdaq Composite (see chart here) has been the big winner so far this year and technically speaking this index could potentially keep running. Heck, i’d be ok if it paused and consolidated a bit because of the run its been on. The other index that I keep an eye on is the small-cap Russell 2000 (see chart below). Speaking of consolidation, that is what appears to be happening with the Russell 2000. This index has been trading sideways for the past week or so and is trading consistently above its 20 and 200-day moving averages during this consolidation period. So all in all the aforementioned indexes appear to be on solid ground from a technical analysis standpoint.

In closing, despite the current shape of the market, the month of August historically tends to be a volatile month. Couple this with the upcoming Presidential election and we could be in for a wild ride between now and election day.

Good luck to all 🙂

~George

Big Tech Blowout - Paula Mahfouz

A Sell The News Environment?

We are almost at the midway point of earnings reporting season and it appears that we are in a “sell the news” type environment. Amazon (Symbol: AMZN), Intel (Symbol: INTC), Bank of America (Symbol: BAC) JP Morgan Chase (Symbol: JPM) are amongst other high profile companies that have smashed it out of the park with their latest quarterly earnings reports and yet the market does not seem to care. At best stocks have gone sideways with breakout moments only, only to find themselves priced back where they started before their earnings reports. One could say that stocks have already priced in their respective growth and the markets seem to agree. To close out the month of April, the Dow Jones Industrial Average (chart) closed at 24,163, the S&P 500 (chart) finished the month at 2648, the Nasdaq Composite (chart) closed at 7066 and the small-cap Russell 2000 (chart) settled at 1542.

As mentioned above, we are around the mid-point of the season and there are still hundreds of companies that are set to report their earnings this week which includes the likes of: Apple (NasdaqGS: AAPL), Devon Energy Corp. (NYSE: DVN), Gilead Sciences Corp. (NasdaqGS: GILD), Snap Inc (NYSE: SNAP), Avis Budget Group (NYSE: CAR), Caesars Entertainment Corp (NYSEL CZR), CVS Health Corp. (NYSE: CVS), Estee Lauder Companies Inc. (NYSE: EL), Holly Frontier Corp. (NYSE: HFC), Mastercard Inc. (NYSE: MA), MetLife Inc. (NYSE: MET), Yum! Brands Inc. (NYSE: YUM), Avon Product Inc. (NYSE: AVP), CBS Corp. (NYSE: CBS), Ferrari NV (NYSE: RACE), Kellogg Co. (NYSE: K), Shake Shack Inc. (NYSE: SHAK), Sprouts Farmers Market Inc. (NasdaqGS: SFM), Weight Watchers International Inc. (NYSE: WTW), Celgene Corp. (NasdaqGS: CELG) and Cheniere Energy Corp (NYSE: LNG). These are just a few of the names that report this week and as you can see there is a wide variety of companies that could potentially move the market from its most recent sideways action. Good luck to all 🙂

~George


Tech Stocks Under Fire!

Despite a modest rebound on Friday tech stocks remain under fire. From Facebook (NasdaqGS: FB) to Tesla (NasdaqGS: TSLA) and now even Amazon (NasdaqGS: AMZN) are all under pressure for a variety of reasons. This is spilling over into the overall tech sector (see chart below) and even into the overall marketplace. Facebook is facing significant scrutiny regarding user privacy while Tesla continues to trip up with deliveries and debt issues and now even Amazon is under pressure due to President Trump’s direct attack on the online retailer’s sales tax structure. This was enough to send the major averages down to close out the quarter at or in negative territory. The Dow Jones Industrial Average (chart) finished Q1at 24103, the S&P 500 (chart) closed the quarter at 2640, the Nasdaq Composite (chart) closed at 7063 and the small-cap Russell 2000 (chart) finished the first quarter of the year at 1529.

What was also obvious in Q1 was how volatility came back to life. For years the market was in a lullaby state melting up and setting record after record. Well the first quarter has swiftly reminded us on how markets can and should behave. Investors that placed money into mutual funds or passive funds over the past several years made out like a bandit with not a worry in the world. Abnormal stock market gains were in vogue especially after the election. Now with rising interest rates, the Federal Reserve reducing its debt load and the daily drama out of Washington DC, I think it is safe to say the melt up mode and daily records being set are in the rear view mirror. That said, market corrections are very normal and healthy and so is volatility at least for traders that is 🙂

Looking ahead and with earnings reporting season right around the corner, let’s see how corporate America fared in the first quarter of the year. This could be the catalyst that calms things down a bit but in the same breath should there be any slippage in earnings growth, we could be in for more even more volatility. Good luck to all 🙂

~George

Nasdaq - george mahfouz jr

Big Time For Big Tech!

Large cap tech stocks have taken center stage this earnings reporting season big time! Absolute blowout earnings reports came in from Amazon (NasdaqGS: AMZN), the parent company of Google, Alphabet (NasdaqGS: GOOGL) and the elders of the group Intel Corp (NasdaqGS: INTC) and Microsoft (NasdaqGS: MSFT). These tech titans are the latest reason for the Nasdaq (chart) and S&P 500 (chart) to reach and close at record highs yet again. The Dow Jones Industrial Average (chart) and the small-cap Russell 2000 (chart) are also within striking distance of their all times highs. Market observers have attributed the strength in stocks this year to a continuing low interest rate environment and the upcoming new tax policy from the Trump administration. This I get, however, no one can deny the growth that is happening in the tech world as well as other sectors of the economy.

The one note of caution I have here is the exuberant environment we find ourselves in with record highs happening weekly and in some instances daily. Yes earnings reporting season so far has been stellar but let’s not forget that we have not seen price to earnings ratios this elevated in quite some time. The question that now comes to mind are the markets and the aforementioned stocks finally at fair value? Especially as the p/e’s increase and as we approach a much higher interest rate environment over the next two years. We have been in such an accommodative monetary state for almost a decade which without a doubt has been the catalyst for equities and indexes and now the federal reserve here in the U.S. is reversing course. One of the groups that get the most affected in a higher interest rate environment are growths stocks like the aforementioned tech titans.

I am not suggesting that these stocks will not continue their upward trajectory, but I am making note and will be paying closer attention to the overall price to earnings ratios of the indexes and of high growth stocks in general as p/e’s continue to elevate. Good luck to all 🙂

~George

Tech Stocks Hit The Brakes!

After going up in a straight line for months, the technology sector (see chart below) has reversed its upward course. After hitting an all-time high of 6341.70 on June 9th, the Nasdaq (chart) has given back 190 points or three percent while approaching its 50-day moving average. Nowadays it’s pretty rare to see a one percent pullback in tech stocks let alone a three percent retracement in a week. The media is now all over how tech stocks today are beginning to resemble the internet bubble. The difference between today and yesteryear is that the top five tech stocks – Amazon (NasdaqGC: AMZN), Apple (NasdaqGC: AAPL), Facebook (NasdaqGS: FB) Google’s parent company Alphabet (NasdaqGC: GOOGL) and Microsoft (NasdaqGC: MSFT) have been responsible for a big chunk of the Nasdaq and S&P 500 (chart) recent gains. The problem with comparing today’s market with the internet bubble is that the aforementioned tech leaders all have incredible balance sheets while continuing to grow at a pace that supports their relative stock prices. One may argue that Amazon remains overpriced especially with its lofty P/E ratio.

It’s hard to imagine that anyone would be concerned about a three percent pullback in any stock or index, but because of how strong stocks have been since the election, anything other than a flat to up day will get noticed. That said, without question all eyes will be on whether or not the Nasdaq’s 50-day moving average will get tested. The last time the Nasdaq (chart) did not hold its 50-day support line was last October. Since then tech stocks have tested and moved off of its 50-day average multiple times. 6085 is the current the 50-day moving average of the Nasdaq which is about 65 points away. I am not suggesting it will go there, but if it does and according to the way tech stocks have reacted to that particular support line, a bounce could be in the cards. Good luck to all 🙂

~George

Nasdaq chart - George Mahfouz Jr

No Fear Here…

Despite North Korea launching its seventh missile test of the year on Sunday and the White House seemingly in an upheaval, stocks continue to demonstrate no fear and continue their record setting ways. Today the S&P 500 (chart) and the Nasdaq (chart) hit all time highs. Without question this bull market is now even catching wall street veterans off guard. Q1 earnings reporting season is close to wrapping up and other than retail, most companies have reported in-line or outright beats in their earnings results, especially the tech sector. Tech has been on fire lately and this is due in large part of mega-cap tech smashing analysts expectations. Earnings results from companies such as Apple (NasdaqGS: AAPL), Amazon (NasdaqGS: AMZN), Alphabet (NasdaqGS: GOOGL) and Facebook (NasdaqGS: FB) has propelled the Nasdaq (chart) and these particular issues to all-time highs. The Dow Jones Industrial Average (chart) and the Russell 2000 (chart) remain in striking distance of setting new records as well. It is truly remarkable how the markets have been able to weather the current political environment here in the U.S. and the geopolitical risks abroad.

From a technical perspective, the aforementioned key indices are in pretty good shape. The Nasdaq (chart) is the only one of the four that remains in overbought territory according to the relative strength index. All of these averages also remain above their respective 50-day and 200-day moving averages, yet another bullish sign. Volatility also remains at historic lows. So one may ask what about the “sell in May and go away” adage? From a technical standpoint, I do not see any reason why these markets won’t continue to melt up from here. Of course there is always the risk of a geopolitical event or the actual seasonal risk of assets taking a pause or retracing a bit. That said and whatever the case may be, it is undeniable that the markets have been the most resilient in years, if ever.

Good luck to all 🙂

~George