It’s A Broken Record!

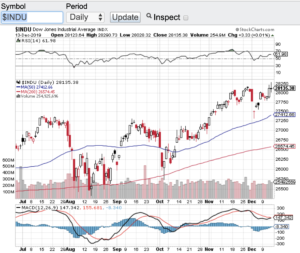
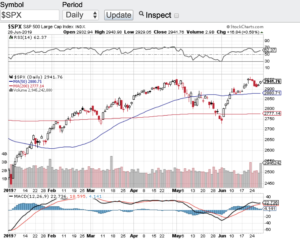
It’s a broken record indeed! That is the continuing record breaking run on Wall Street. On Friday the Dow Jones Industrial Average (see chart here), the S&P 500 (see chart here), the Nasdaq Composite (see chart here) set new all time highs. Seemingly, there is no stopping this record setting run that the markets have been on, at least for now. The latest catalyst was news out of Washington that the U.S. and China are close to coming to a “Phase 1” agreement on a trade deal. As I eluded to in my November 15th blog, new record highs could come into play by year-end if we see a trade deal happen. The caveat here is the deal is being titled as a “Phase 1” agreement and there is much more to agree upon to finish the deal out. That said, this is a definite step in the right direction and the markets seem to agree. I do want to keep my enthusiasm in check because of the volatility that continues to come out of Washington on this subject. We have all seen over the past several months tweets and statements out of Washington that we are close to a deal with China to only then wake up the next day to get the opposite statement either out of Washington or China. Phase 1 is a great step, but I am looking forward to the complete deal getting done and most likely that will yield to the first quarter of 2020.

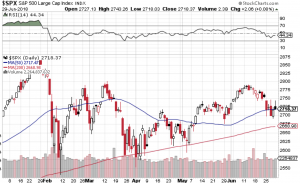
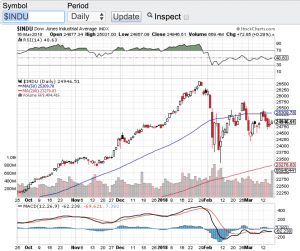
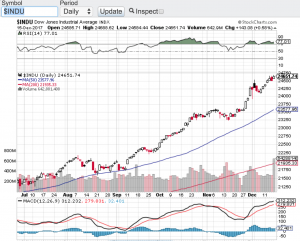
In the meantime, investors are continuing to enjoy record highs and there doesn’t seem too much ahead between now and year-end that will change the course. The technical shape of the bellwether indexes remain intact. The Dow Jones Industrial Average (see chart below), the S&P 500 (chart) and the Nasdaq Composite (chart) are all trading below the 70 value level of the relative strength index (RSI). Also, each of these indexes are trading healthily above their 20, 50, 100 and 200 day moving averages.Β Β 

Paula and I wish everyone a very safe and happy holiday season.

~George

It's A Broken Record! - Paula Mahfouz


Is More Volatility Ahead?

The month of August proved to be one of the more volatile months so far this year. The question now is will this volatility continue here in September? As long as the turbulent tweets continue out of Washington, I bet the vol we witnessed in August will indeed continue this month. Markets hate uncertainty and as long as our President continues to flip flop seemingly daily and then tweet about it, we could very well be in for more vol. It’s not rocket science, when the tweets are positive and have consistency, stocks go green. Then when the flip flopping occurs they go red. It is amazing to me how stocks react to every single tweet or flip out of Washington. Sure there are algorithms that are programmed to react to headlines, but because of the constant noise out of Washington it’s no wonder we have been whipsawing around.

I always try to tune out the noise and focus on the fundamentals and technical shape of the markets. Let’s take a look at the current price to earnings ratio (click here) of the S&P 500. The S&P 500 (see chart here) price to earnings ratio continues to trade above historic norms. Despite all of the current uncertainties especially with the trade war, stocks on average are still trading above the 20 PE ratio level. The historic price to earnings average for the S&P 500 is somewhere in the mid-teens. So from a fundamental valuation standpoint the markets remain at the upper end of the channel. There are many other valuation metrics and government policies that play into the valuation analysis mix, but purely from a price to earnings ratio, one can ascertain that we remain a bit overpriced.

That said, companies can certainly grow into their current valuations but we definitely need to get the trade war with China resolved so that companies know where they stand. Both Paula and I wish everyone a very happy and safe Labor Day weekend πŸ™‚

~George


One Hot June!

One hot June indeed and I do not mean the weather folks! Stocks and commodities went on a tear in the month of June logging the best June in decades for some of the indexes and other asset classes. The Dow Jones Industrial Average (see chart here) soared over seven percent last month. The S&P 500 (see chart below) hit an all time high in the month of June while both the Nasdaq Composite (see chart here) and the small-cap Russell 2000 (see chart here) notched impressive gains as well. What’s more is both oil and gold surged right along side of the key indexes.

So why the rally? I think the answer is simply an easier monetary posture by the Federal Reserve. It is no secret that inflation is well in check and it is also becoming apparent that the U.S. job market is cooling off. Another factor for the Fed to consider is what impact would a full blown trade war with China do to the U.S. economy? This is why in my opinion we are seeing a continuing upward trend in our markets and that is a dovish Fed is usually very good for stocks. One other factor that will certainly weigh in is the upcoming earnings reporting season. Now that the second quarter of the year is in the books we will see how well corporate America did in Q2 as earnings reporting season gets underway this month. I will continue to look to monitor how “top-line” growth is faring.

Let’s take a quick look at the technical shape of the key indexes. After surging over 7% in June, the Dow Jones Industrial Average (see chart here) remains clearly above its 20-day, 100-day and 200-day moving averages as does the S&P 500 (see chart here). The Nasdaq Composite (see chart here) is in a healthy technical condition and last but not least, the small-cap Russell 2000 (see chart here) has broken above its key moving averages. This is a very good sign for stocks and furthermore none of indices are in overbought territory according to the principles of the RSI also known as the relative strength index.

Both Paula and I wish everyone a very safe and Happy 4th of July holiday πŸ™‚

~George

S&P 500 - Paula Mahfouz


Is A Retest In The Cards?

Stocks apparently want to move higher and now the question comes to mind is a retest of the all time highs in the cards? Well if you look at the S&P 500 (see chart below) it sure seems so. The S&P 500 (chart) is at the earliest stages of technically breaking out of a 4 month trading range. Back in early November and again in early December the S&P flirted with the 2800 level before failing that level each time. In fact, in early December when the S&P tried to break the 2800 level not only did it fail to break through, it also went on to hit multi-year lows by the end of December. This is the time period where the bears started to growl and predict that stocks would continue to fall. Fast forward to today and not only did stocks reverse course since that late December sell-off, but now the key indices appear to be on the verge of breaking out. The Dow Jones Industrial Average (see chart here) also has bounced off its multi-year lows in December and is trading above its key moving averages, the Nasdaq Composite (see chart here) from a technical standpoint is also on the verge of breaking out, however the small-cap Russell 2000 (see chart here) has work to do to reclaim its 200-day moving average.

So what does all this technical jargon mean? It’s no secret the markets trade in algos and bots. Many of these algorithm trading platforms are programmed to certain technical indicators i.e. the 20-day, 50-day, 100-day and 200-day moving averages and/or the relative strength index aka the RSI. Furthermore, in many instances when the key indices are setup at a breakout level such as where the S&P 500 (see chart here) and the Nasdaq Composite (see chart here) find themselves at, momentum traders also come up to the plate and act. So we could very well indeed see the markets make a run to retest the all-time highs. Paula and I wish everyone a safe and Happy St. Patricks Day!

Good luck to all πŸ™‚

~George

S&P 500 - George Mahfouz Jr

Happy New Year!

Happy New Year! Well if you have been long the markets and with the way stocks closed out 2018, it wasn’t so happy for the bull camp. However, a new year means new beginnings :-). Let’s do take a gander to see how the major averages fared in 2018. The Dow Jones Industrial Average ( click here or see chart below) finished the year down 5.6%, the S&P 500 (chart) closed the year down 6.2%, the Nasdaq Composite (chart) closed down 4% and the small-cap Russell 2000 (chart) closed 2018 down 12%. This is the worst performing year for stocks in a decade.

So what happened? In my view and simply put how can stocks go up in a straight line for over a decade without a correction? That’s right, stocks essentially have gone up for over 10 years’ without a healthy 20% correction. So when the markets finally had a real correction which is what occurred in the 4th quarter, it felt like the sky was falling. No question the Federal Reserve and rising interest rates have played a role in the market correction, however, let’s keep this in mind a 2-2.5% Fed funds rate is still historically low. What wasn’t normal over the past decade was a 0 percent interest rate policy and no market volatility. Everyone got spoiled with such an accommodative policy and market environment.

Another factor playing into the mix of the Q4 market correction is without question the trade war and tariffs that our President has ignited. This to me is even more of an issue to our economy than rising interest rates lifting to a normalized level. Not only is the trade war and its ramifications playing a role, but the inconsistency and chaos out of Washington are wreaking havoc on the markets.Β  No doubt in my mind that investors and Wall street are falling out of love with how our country is being governed, especially over Twitter. This is all fixable, we will just have to wait and see if the ego’s and the political agendas on both sides of the aisle can get the confidence back in our marketplace. Paula and I wish everyone the happiest and most prosperous 2019.Β  Good luck to all πŸ™‚

~George

Dow Jones Industrial Average - George Mahfouz Jr

Bellwether Indexes Surge To All Time Highs!

Bellwether indexes surge to all time highs as the S&P 500 (chart) closed the month of August at 2901, the Nasdaq Composite (chart) closed at 8109, the small-cap Russell 2000 (chart) closed at 1740 and the Dow Jones Industrial Average (chart) is within striking distance of its all time high. I thought August is supposed to be a tough month for stocks? Not this year! New highs are happening while the political environment in our country is at a seemingly all-time low, the word impeachment surfaces daily now, tariffs are in the headlines daily, interest rates have been on the rise and now it seems that any type of progress made over the summer with North Korea may be in jeopardy. One would think that the aforementioned risks would be enough for an outright 10-20 percent market correction. Add in the seasonality factor and we should indeed be going red, not making all-time highs.

Now I am afraid to even mention that the month of September is historically the weakest month of the year for stocks right alongside with August. Do I dare say that September will be the month that our markets correct in a meaningful way? Do I have the courage to predict that this will be the month where the markets recognize and adjust for all of the risks that are present in our current environment? I don’t know people, I am as baffled as the next guy as to how these markets keep shrugging off real market issues. Oh by the way I forgot to mention we have mid-term elections forthcoming, the markets are not pricing in any risk there either. These markets are priced and acting like there is no absolute risks at all out there. Ok enough banter already!

How to play the markets now? I am a fan of the old adage “the trend is your friend” but folks I just can’t hop on this train at this point in time. I am heading to the sidelines until I see any type of technical breakdown to possibly consider implementing a short thesis or just wait for the inevitable pullback/sell-off to identify any potential long set-ups. Until then, Paula and I wish everyone a very safe and Happy Labor Day weekend πŸ™‚

~George

First Half Of 2018 In The Books…

The first half of 2018 is in the books and where in the world did that go? Year to date the Dow Jones Industrial Average (chart) is off about one percent, the S&P 500 (see chart below)Β is up a couple of percentage points but the Nasdaq Composite (chart) and the small-cap Russell 2000 (chart) are way outperforming the other benchmark indexes closing the first half of the year up almost 10% each.

Let’s take a look how the second half of the year is shaping up. We start off the second half of the year with of course the fourth of July holiday which this year happens to be in the middle of the week. I don’t expect too much market action this upcoming week especially with a shortened trading session on Tuesday followed by the markets closing on Wednesday in recognition of the 4th of July. There could be some positioning going on both Thursday and Friday after the holiday. but all in all I am expecting lighter volume throughout the week with not too much volatility. Now the following week and the second half of the year is a whole different story. Q2 earnings reporting season will begin in earnest the week of July 9th and this my friends will be the true beginning of the second half of the trading year. I expect volatility to kick in once again as corporate America unveils their most recent quarterly results. Furthermore, we will be getting ever closer to the midterm elections that promises to be filled with about as much drama and rhetoric one can imagine. Also, historically stocks have witnessed meaningful corrections at some point during the year leading up to the midterms and I do not expect this year to be any different. I also expect corporate America to report impressive growth to their top and bottom lines; however, these results may already be priced in.

Technically speaking the aforementioned indexes all remain above their respective moving averages with the Dow Jones Industrial Average (chart) hovering right around its 200-day. Paula and I wish everyone a very safe and Happy 4th of July πŸ™‚

~George

S&P 500 - Paula Mahfouz


Red Week For Stocks, Technicals In Play…

Stocks had a tough week pressured by the prospects of rising interest rates and political turmoil out of Washington D.C. On the week, the Dow Jones Industrial Average (see chart below) closed lower by 1.5%, the S&P 500 (chart) closed the week down 1.2%, the Nasdaq Composite (chart) finished lower by 1% and the small-cap Russell 2000 (chart)Β ended the week down around 1% as well. Despite a choppy and red trading week, all of the aforementioned indexes are still up on the year.

As we celebrate St. Patrick’s Day we find ourselves in a period of no real short term catalysts to steer the market in either direction other than the FOMC meeting next week. I don’t expect the Federal Reserve to surprise the markets with a larger than expected interest rate hike or change their view on interest rate policy this year. The inflation data continues to remain tame although the labor market is heating up. So what is going to drive stocks between now and Q1 earnings reporting season in April?

When we find ourselves in a period such as the one we are in, I focus in on the technical shape of the markets. And as you can see in the charts of the major averages, all of them are at theirΒ moving averages support. Whether it’s the 9 day, 20 day, 50 day, 100 or 200 day moving average, stocks and indexes typically respect and is supported by moving average support lines with the 200 day moving average being the most reliable out of all of them. This doesn’t mean that this favorite technical indicator of most market technicians is infallible, but it sure has a history of being an effective tool when navigating the markets. All things considered, including the seasonality of the markets, I do expect that these support levels should hold at least until Q1 earnings reporting season. If the moving averages don’t hold, then I would not be surprised if we revisit the early February market correction lows. Good luck to all and Paula and I wish everyone a safe and Happy St. Patricks Day πŸ™‚

~George

Dow Jones Industrial Average - Paula Mahfouz

New Year, New Records?

Happy New Year! Will 2018 be a new year of new records? Nothing would surprise me. Especially as the Dow Jones Industrial Average (chart), the S&P 500 (chart), the Nasdaq (chart) and the small-cap Russell 2000 (chart) shattered record after record after record in 2017. In fact the Dow Jones Industrial Average set 70 record closing highs in 2017. That’s not a typo folks, 70 record closing highs. The other aforementioned key indices also set multiple record highs throughout last year. So could we see a repeat performance in 2018? I don’t know about another 70 record highs this year but I would not be surprised to see continuing strength in the markets in 2018. Yes the Federal Reserve is now in a rate hike mode which typically does not bode well for stocks, but this Fed and central banks from around the world understand the need to go about their new rate hike policies in a gradual manner. Raising rates too aggressively could be the exact catalyst to put the brakes on this almost decade long bull market. I don’t think this will be the case at least with our own Federal Reserve. Jerome Powell will be replacing Janet Yellen in early February as our new Federal Reserve Chairman. Mr. Powell who has been a member of the Federal Reserve’s board of governors since 2012 has voted for keeping interest rates at bay while the economy continues to recover.

Speaking of the economy, expansion continues to occur and we will soon find out how our economy isΒ  trickling down into corporate America. Fourth quarter earnings reporting season will begin here in January and this could very well serve as a key catalyst for the continuation of the bull market. That said, I think most investors and traders are looking for the markets to pause and pullback from this historic run we continue to be on. It is truly breathtaking to witness the record pace that stocks have enjoyed for years now. Personally, I hope and some point in time we do get a meaningful pullback so we can have the opportunity to step in at lower prices. Good luck to all and Paula and I wish everyone the healthiest and happiest new year! πŸ™‚

~George

Within Striking Distance!

In my previous blog, I said I wouldn’t be at the very least surprised if the Dow Jones Industrial Average (see chart below) closed above 25000 by year end. Well don’t look now, we are in striking distance of that milestone. In fact, if the Dow does close above 25000 by year end, it would have taken it a month to do so. That’s right only a month! In late November the Dow closed above the 24000 mark for the very first time and now its a mere 350 points away from yet another 1000 point gain. What’s impressive about this 1000 point clip is how fast it is getting there, I mean a month? This is unprecedented for sure. Market observers are expecting this insatiable bull market to keep on truckin into the end of the year, especially if the tax bill goes live! The S&P 500 (chart) and the Nasdaq Composite (chart) also closed at records highs on Friday with the S&P 500 closing in on the 2700 mark and the Nasdaq approaching the 7000 mark. The small-cap Russell 2000 (chart) is lagging behind but on Friday the Russell did find support at its 200-day moving average to close higher on the week.

With only 2 weeks left in the trading year what can investors or traders expect? More of the same or a sell the news type event? The news being the proposed tax bill getting through and going live. I truly don’t know? However, when you add seasonality into the mix with December being one of the strongest months for stocks on the year, I would not be surprised if the Dow Jones Industrial Average does indeed eclipse the 25000 mark. We could also see the S&P 500 overtake 2700 and the Nasdaq surpass 7000. Now if there is a snag in getting the tax bill through or if it ends up being a “sell the news” type of event meaning the proposed tax bill does go through by year end, then I will have a much different take heading into the new year. Both Paula and I wish everyone the healthiest and happiest holiday season πŸ™‚

~George

Dow Jones Industrial Average - Paula Mahfouz