What Happens Next?
What happens next is the question that just about everyone is asking now? After the onslaught of tariffs and executive orders, the markets have reacted accordingly. Heavy selling pressure has gone on since mid-February with a couple of strong bounces in between. Currently we find ourselves in yet another bounce back from the latest stock market selloff which occurred yesterday. For those who love volatility and trade around vol, you are having a field day, and this is your time. For those who have long term investments I think it is safe to say the last couple of months have been unnerving to say the least.
Over the past 25 plus years I have witnessed multiple markets and backdrops such as the one we have today however, those were for different reasons. The over exuberant dot-com bubble and the 2008 market crash when the banking system was on the brink of a total collapse. Today, we are not in this type of environment, but nonetheless, the tariff initiative needs to be monitored and managed properly so that we don’t fall into a scenario that would impact the markets long-term. I am hopeful that both sides in each tariff dynamic can come to a meeting of the minds.
As I look at the major averages I am seeing support in these selloffs, but I am also seeing resistance when stocks do bounce and try to restart an uptrend. I think we will be in this type of market for the foreseeable future whereas volatility will remain in play. For market vol to abate, the markets need to see how these tariffs will play out or if they will be adjusted so that agreements can be had. It appears adjustments will be happening.
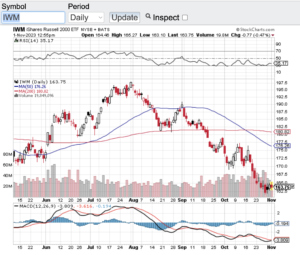
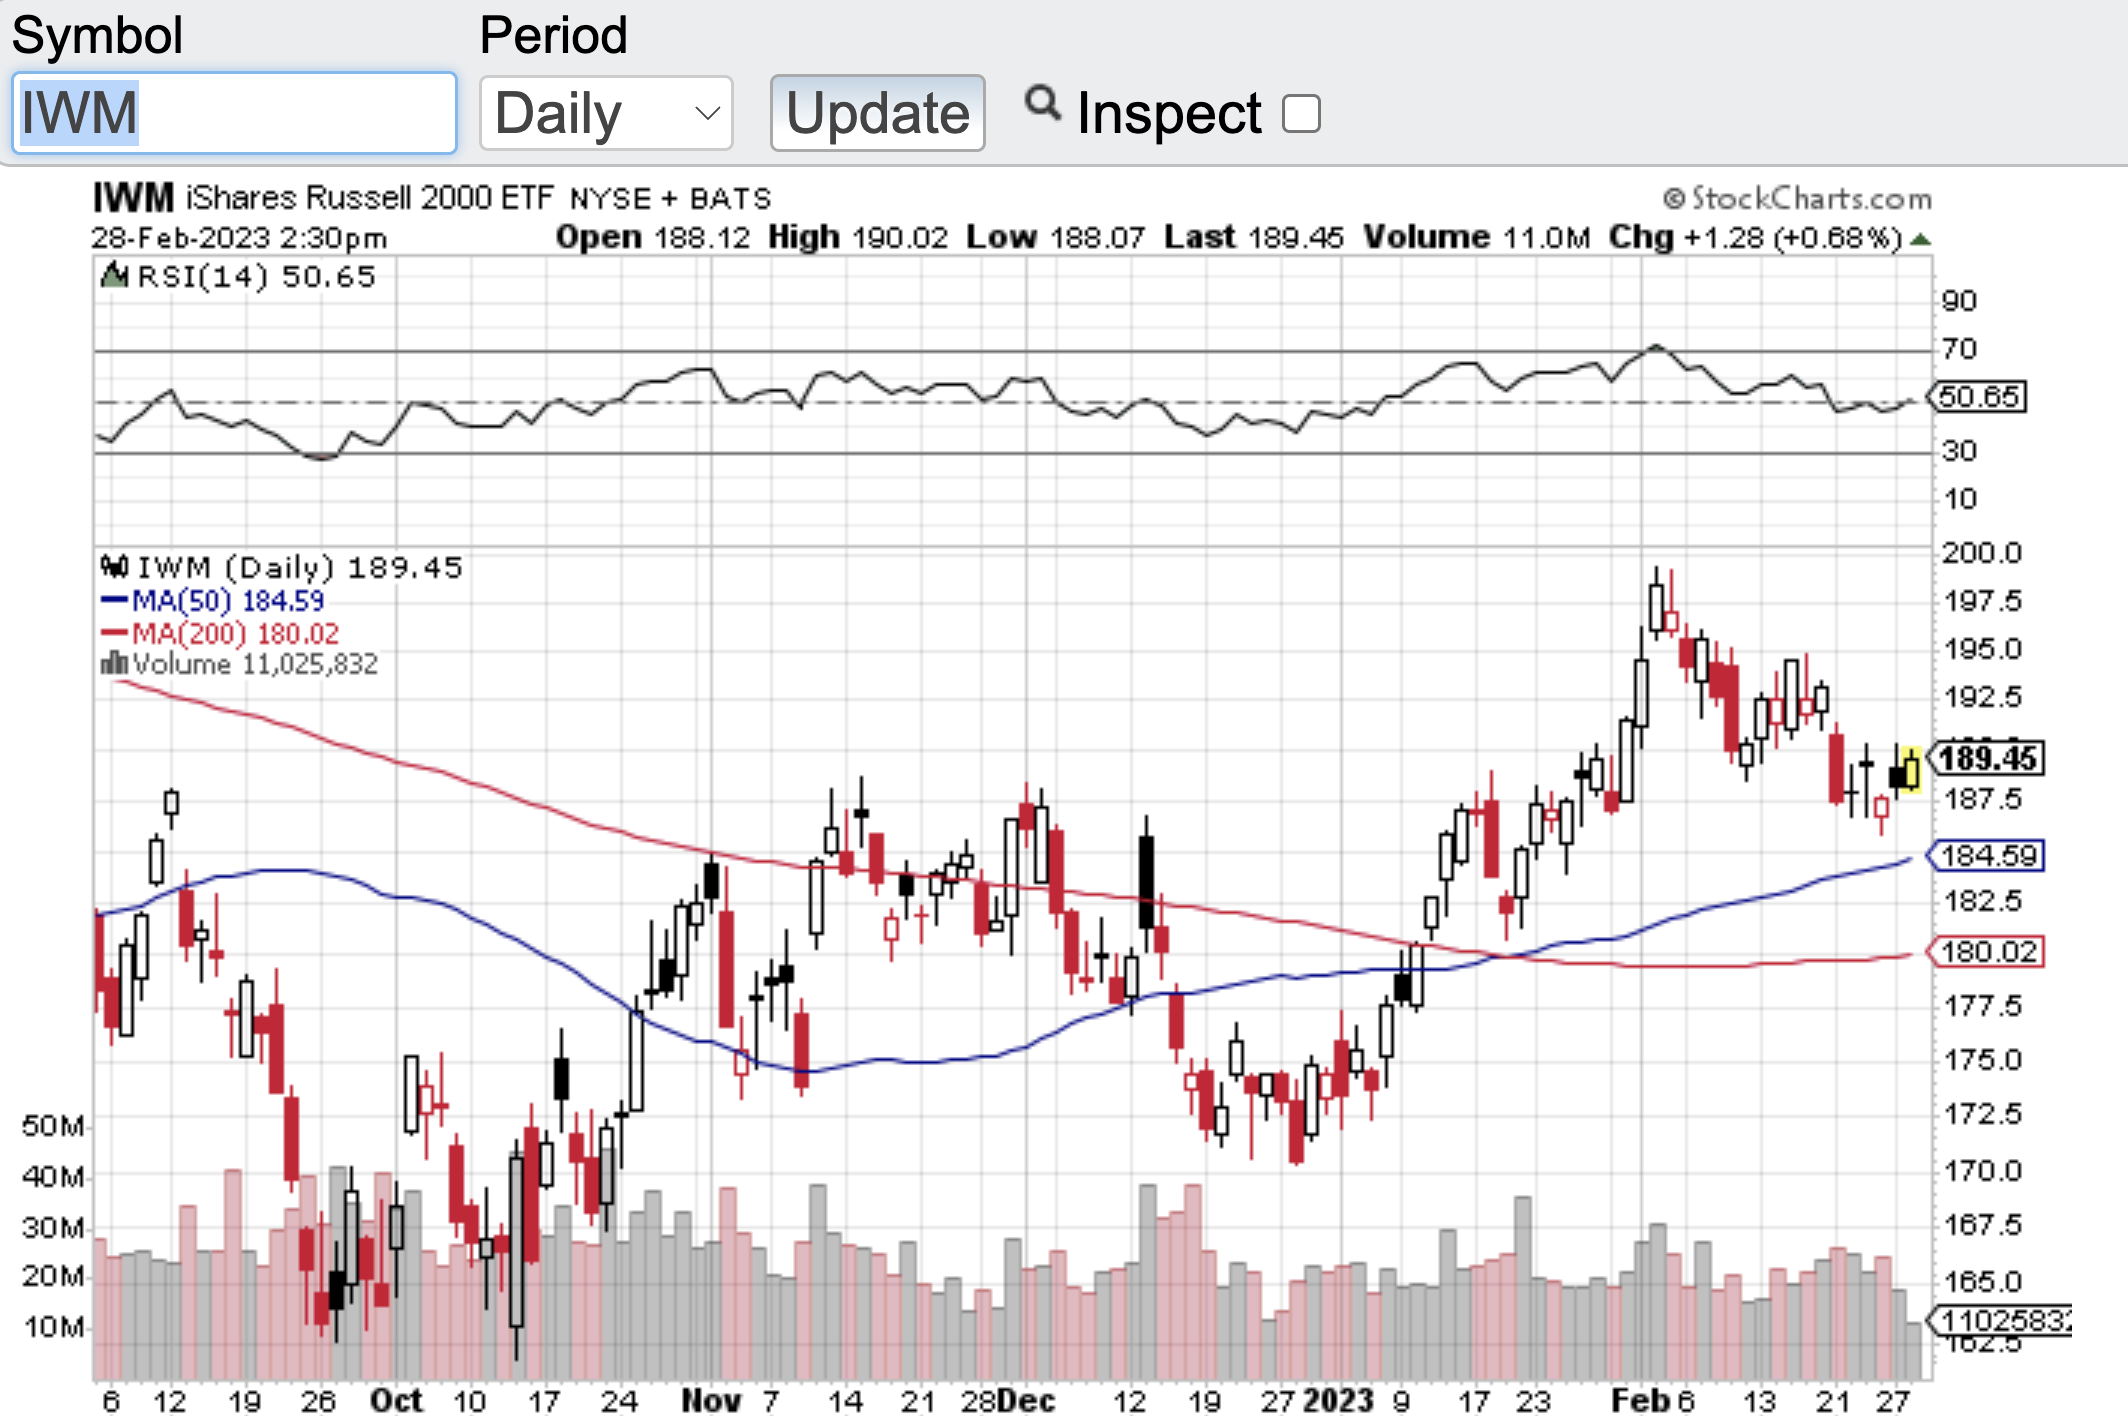
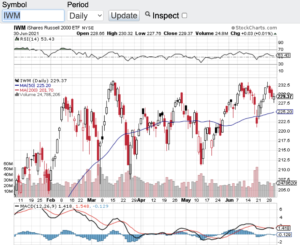
The Dow Jones Industrial Average (see chart here) closed the month of April at 40,669, the S&P 500 (see chart here) closed at 5,569, the Nasdaq Composite (see chart here) 17,446 and the small-cap Russell 2000 (see chart here) finished the month of April at 1,964. Let’s not forget that the major averages have enjoyed record after record years before this disruption and quite honestly, weren’t we due for some kind of correction? Think about that and from my vantage point stocks and indexes are not acting too badly all things considered. Good luck to all 🙂
~George