Tis The Season…

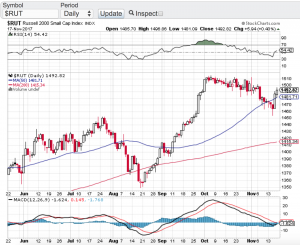
As the holiday season fast approaches stocks have a lot to be jolly for. Despite the recent pop in volatility, the major averages continue to enjoy their record setting ways. The Dow Jones Industrial Average (chart) closed the week at 23,258, the S&P 500 (chart) finished the week at 2,579, the tech focused Nasdaq composite (chart) closed at 6,783 and the small-cap Russell 2000 (see chart below) ended the week at 1,493 while recapturing its 50-day moving average.

Next week is a shortened trading week due to Thanksgiving. Historically the Thanksgiving holiday week tends to be a bullish week for equities with 75 percent of the time the markets finish higher. Add the seasonality factor into the mix and things look pretty good between now and year end. This doesn’t mean that things won’t be choppy along the way especially as the yield curve has many investors paying closer attention to it. Interest rate chatter is seemingly picking up lately despite the Federal Reserve being candid about their position and intentions. This will become further apparent when Fed chair Yellen speaks next week along with the release of the minutes from the last Federal Reserve meeting. All in all it appears that the status quo should be in place between now and year and if this is the case, new market highs should be set.

Earlier I spoke to how the small-cap Russell 2000 ( see chart below) has recaptured its 50-day moving average. This is important from the standpoint that investors and traders alike look to the Russell as a key indicator to the overall health of the broader markets. Recently the Russell has been showing some cracks in its trading patterns including noticeably breaking its 50-day only to recapture it and hold above it a few days later. If you are long this market, this is a bullish sign. That said, I do expect volatility to be present between now and year with the potential of making new highs along the way.

Paula and I wish everyone a very safe and Happy Thanksgiving 🙂

~George
Russell 2000 Paula Mahfouz

Tech Stocks Hit The Brakes!

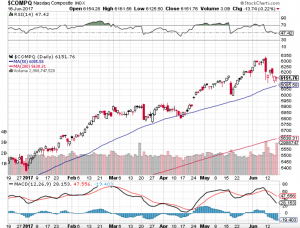
After going up in a straight line for months, the technology sector (see chart below) has reversed its upward course. After hitting an all-time high of 6341.70 on June 9th, the Nasdaq (chart) has given back 190 points or three percent while approaching its 50-day moving average. Nowadays it’s pretty rare to see a one percent pullback in tech stocks let alone a three percent retracement in a week. The media is now all over how tech stocks today are beginning to resemble the internet bubble. The difference between today and yesteryear is that the top five tech stocks – Amazon (NasdaqGC: AMZN), Apple (NasdaqGC: AAPL), Facebook (NasdaqGS: FB) Google’s parent company Alphabet (NasdaqGC: GOOGL) and Microsoft (NasdaqGC: MSFT) have been responsible for a big chunk of the Nasdaq and S&P 500 (chart) recent gains. The problem with comparing today’s market with the internet bubble is that the aforementioned tech leaders all have incredible balance sheets while continuing to grow at a pace that supports their relative stock prices. One may argue that Amazon remains overpriced especially with its lofty P/E ratio.

It’s hard to imagine that anyone would be concerned about a three percent pullback in any stock or index, but because of how strong stocks have been since the election, anything other than a flat to up day will get noticed. That said, without question all eyes will be on whether or not the Nasdaq’s 50-day moving average will get tested. The last time the Nasdaq (chart) did not hold its 50-day support line was last October. Since then tech stocks have tested and moved off of its 50-day average multiple times. 6085 is the current the 50-day moving average of the Nasdaq which is about 65 points away. I am not suggesting it will go there, but if it does and according to the way tech stocks have reacted to that particular support line, a bounce could be in the cards. Good luck to all 🙂

~George

Nasdaq chart - George Mahfouz Jr