The 200-Day Moving Average Holds!

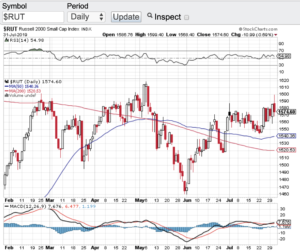
The 200-day moving average held its ground despite the constant tape bombs and tweets that continues to come out of Washington. It is no secret that stocks have been on a wild ride over the past few weeks from making all-time highs to rip roaring selloffs. The continuation of tariff threats out of Washington has been a huge catalyst for the increase in volatility in stocks. That said, with all of the madness that is swirling around the Dow Jones Industrial Average (see chart here), the S&P 500 (see chart here) and the Nasdaq Composite (see chart here) have all managed to stay above their respective 200-day moving averages. This key technical support line has held true to form during these market selloffs. The small-cap Russell 2000 (see chart here) has not been as fortunate and could not hold its 200-day.

So in addition to the Washington D.C. threats of additional tariffs, the markets also had to deal with the dreaded 10-year and 2-year yield curve inverting. Whenever longer term interest rates fall below shorter term interest rates in the bond market that historically is a signal that a recession might be looming. Now there is a meaningful lag here whenever we see the yield curve inverting, so as long as the curve flattens out and returns to a normalized dynamic, we should escape the threat. However, if the yield curve remains inverted for an extended period of time then we could be in for something else.

Let’s get back to the technical shape of the markets. As mentioned, three of the four major averages held above their respective 200-day moving average support line which is a good thing technically. What also helped is during these meaningful selloffs is that the markets did go into oversold territory and technically bounced. Let’s see how the next couple of weeks shape up as we wind down the dog days of summer.

Good luck to all 🙂

~George

First Rate Cut In Over A Decade!

Yesterday the Federal Reserve conducted its first rate cut in over a decade! Although widely expected, the markets were disappointed as to how Fed Chairman Jerome Powell signaled that this is does not necessarily mean more rate cuts are forthcoming. Chairman Powell’s statement sent stocks down sharply. The Dow Jones Industrial Average (see chart here) closed down over 330 points, the S&P 500 (see chart here) closed lower by 32.80, the Nasdaq Composite (see chart here) finished down almost 100 points and the small-cap Russell 2000 (see chart below) finished the day down 11 points. The markets were hoping that Mr. Powell would remain dovish and it was clear he was the opposite. That said, a rate cut is a rate cut and the intention is to keep the economy moving. Despite the rate cut move, The White House came out and complained about how Chairman Powell handled his statement and it is no secret that administration wants further rate cuts. I do think additional rate cuts may not be needed due to how Q2 earnings reporting season is going so far. The street was expecting an “earnings recession” at least in the last quarter. But as we are now half way through earnings reporting season, so far so good. There are not many earnings surprises to the downside and future guidance is not too shabby so far.

Let’s take a look at the current technical shape of the markets. The indexes have been going sideways as of late with the exception of yesterday’s selloff. That said, yesterday’s selloff did break the 20-day moving averages of the Dow Jones Industrials, the S&P 500 and the Nasdaq Composite, however, the small-cap Russell 2000 closed above its 20 day and actually demonstrated more relative strength than the other averages. A one day selloff does not necessarily mean the beginning of a new downward trend so let’s wait and see how the rest of earning reporting season goes and then we can assess how the back half of the year shapes up.

Good luck to all 🙂

~George

Russell 2000 - Paula Mahfouz