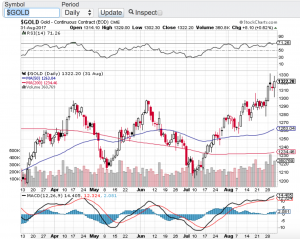
Is Gold Breaking Out?

It certainly appears that way. Gold (see chart below) has caught a meaning bid as of late and it’s about time. The yellow medal has been stuck in a trading range between $1200 and $1300 per ounce for months and now has broke through the $1300 level currently trading around $1330 per ounce. What has surprised me is how long it took for gold to finally go from the left side of the chart to the right. Especially considering the geopolitical risk environment we find ourselves in. That said, stocks are saying what risk? As I write this blog, the Dow Jones Industrial Average (chart), the S&P 500 (chart), the Nasdaq (chart) and the small-cap Russell 2000 (chart) once again are all approaching all time highs. This after a very modest pullback in August. So Wall Street continues to remain in the “buy the dip” mood. All year long and every single time stocks experience any type of pullback, buyers come in and lift the markets to all time highs.

How long can this last? From a technical standpoint the key indices remain below the 70 value level of the relative strength index also referred to as the RSI. The RSI is used as a gauge by certain market technicians to see if whether or not stocks in the short term are overbought or oversold. As as these indexes approach all-time highs and should they breakthrough those highs, these markets can and should continue to go higher. However, if they do not breakout here, then one could expect yet another pullback especially as we are now in one of the more underperforming months for equites of the year. Historically September and October for that matter tends to be a difficult time for the markets. However, based on what we have witnessed all year long despite the ongoing geopolitical risks and with interest rates on the rise, the markets may not care about the seasonality trends of September and October. Good luck to all and both Paula and I wish everyone a safe and relaxing Labor Day Weekend šŸ™‚

~George

Gold chart - Paula Mahfouz

Simply On Fire!

Stocks continue to set records and now on a daily basis! As I am writing this blog the Dow Jones Industrial Average (chart) is now trading north of 20440, the S&P 500 (chart) is trading well above 2300, the Nasdaq (chart) is trading above 5750 and the small-cap Russell 2000 (chart) set an all time high yesterday at 1398! I continue to be amazed on how resilient the markets have been and continue to be. Earlier this monthĀ it appeared that the Trump rally stalled out and it was becoming a wait and see environment. Well now the Trump rally has seemingly reignited. Trump last week announcedĀ he has major news forthcoming on his tax plan and that was apparently the cue for the markets to rally yet again. However, one has to ask how many more tweets, news conferences or headlines can take the markets higher? Without question the above key indices are becoming overbought and especially pertaining to the relative strength index also know as the RSI. Let’s take a look.

Currently the Dow Jones Industrial Average’s RSI (chart) is trading at a 73, the S&P 500 (chart) RSI is also currently at 73, the Nasdaq (chart) is even higher at 77. The only laggard pertaining to the relative strength index and being in an “overbought” condition is small-cap Russell 2000 (chart) in which its RSI is currently at the 60 value level. Remember the relative strength index is a widely utilized technical indicator that certain institutional traders include in their models along with a variety of algorithm trading platforms. The RSI is a momentum indicator that tracks the size of gains and losses over a given period of time with the 70 value level and above as overbought and the 30 value level andĀ below as oversold. One of the concerns certain market technicians have is that these all time highs and overbought conditions have been occurring on relatively light volume. Without trying to call a top here, I suspect that the aforementioned indices and some of the overbought stocks within these indexes are due for a pullback.

Good luck to all and Paula and I wish everyone a Happy Valentine’s Day šŸ™‚

~George


A Ho Hum Q1…

It doesn’t seem like it, but for the first quarter of the year the four major averages were essentially flat. For the quarter, the Dow Jones Industrial Average (chart) closed basically unchanged, the tech heavy Nasdaq (chart) finished up just over 1% percent, the S&P 500 (chart) +2.2% and the small-cap Russell 2000 (chart) closed out Q1 slightly up. Quite an uneventful quarter at least from a P&L standpoint especially considering China’s economic slow down and the Ukraine crisis that unfolded in the quarter. There was a period in late January in which we saw a sharp 5% decline only to be met with unconditional support, followed by a rally which led the markets back to almost unchanged on the year.

As I always do at the end of each quarter, I look at the technical conditions of the aforementioned indexes and how they are shaping up going into a new quarter. There are plenty ofĀ market technicians out there that use a variety of techniques and indicators to identify trends and where the markets may be headed. My preference is to keep things as simple as possible when conducting technical analysis. As you may know by now, two of my favorite technical indicators are the Ā Relative Strength IndexĀ also know as theĀ RSIĀ and theĀ moving averages. Part of the reason why I prefer these two reliable indicators over most is it is now seemingly more than everĀ computerized trading models are emphasizing the RSI and the 20-day, 50-day, 100 and 200-day moving averages in their models. These indicators also have been a long time favorite of institutional investors. So it’s no wonder that when theĀ Relative Strength IndexĀ (RSI)Ā is indicating an overbought or oversold condition in an index or equity, more times than not, the asset finds support and changes direction. The same can be said for theĀ moving averages, whenever a stock or index bumps up against or comes down to its moving average, typically the stock or index finds support or resistance.

Letā€™s break this down in more detail starting with theĀ (RSI),Ā TheĀ RSIĀ is designed to demonstrate whether or not an index or equity is overbought or oversold, depending on certain value levels. According to theĀ RSIĀ principle, the 70 value level or greater, is an overbought condition and the 30 value and below is an oversold condition. Looking at the aforementioned indices now, there is no indication of an overbought or over sold condition. However, both the Nasdaq (chart) and the small-cap Russell 2000 (chart) are trading and have closed below their 50-day moving averages. These two indices have been leading the markets higher and now comparatively speaking, they have begun to lag, a potential short term ominous sign. Now it has only been a couple of days that both of these indexes have been trading below this support line so we will have to wait and see if this turns into a longer term trend.

That said, we will not have to wait much longer. This Friday’s jobs report will shed light as to the health of the labor market and don’t look now but Q1 earnings reporting season is on deck. Without a doubt, Q1 earnings reporting season will be placed under a microscope to see if corporate America and the markets deserve their current valuations. Personally, I think a rather healthy pullback may be in the cards for equities and if so, most likely, the trend of unconditional support will come back into the markets as well.

Good luck to all. šŸ™‚

~George

Technically speaking…

Stocks finished lower for the week as volatility continued to rise. For the week, the Ā Dow Jones Industrial Average (chart) closed down 1.17%, the Nasdaq (chart) -1.32%, the S&P 500 (chart) -1.01% and the small-cap Russell 2000 (chart) closed the week lower by 0.63%.Ā Is this bull market beginning to show signs of fatigue or is this just a typical pre-summer pullback? Let’s take a look at the technical picture of these key indices and see what’s going on there.

Market technicians use a multitude of indicators to discern potential support or resistance levels. My preference has always been to keep things as simple as possible when analyzing charts of stocks or indices. The two indicators I pay the closet attention to is the Relative Strength Index also know as the RSI and the moving averages. Out of dozens of technical indicators that are available, you may ask why do I prefer these particular indicators? The answer simply is that high profile market technicians, Ā computerized trading models and certain institutional investors utilize them. Ā Time and time again when I see that Relative Strength Index (RSI) is indicating an overbought or oversold condition, the majority of the time the asset or index reverts to the mean. Same rings true with the moving averages, whenever a stock or index bumps up against or comes down to its moving average, typically the stock or index finds support or resistance.

Let’s break this down in more detail. Pertaining to the (RSI),Ā TheĀ RSIĀ is designed to demonstrate whether or not an index or equity is overbought or oversold, depending on certain value levels. According to theĀ RSIĀ principle, the 70 value level or greater, is an overbought condition and the 30 value and below is an oversold condition. As of right now the aforementioned indices are hovering around the 50 value level which is not indicating an extreme condition either way. Looking at the moving averages these indices remain above their 50-day moving average and as you can see with the Dow Jones Industrial Average (chart)Ā and S&P 500 (chart), these indexes have bounced off their 50-day moving averages/support lines three times over the past week or so which clearly demonstrates the potential of the power and precision of this particular technical indicator.

So technically speaking, I see nothing that would indicate an extreme condition of these indexes and as long as their are no major surprises out of the FOMC meeting next week, we should see smooth sailing heading into the summer. Good luck to all.

Have a great weekend šŸ™‚

~George