What August Swoon?

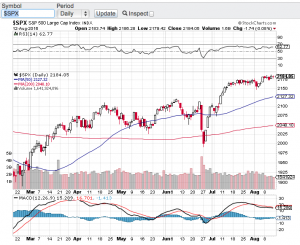
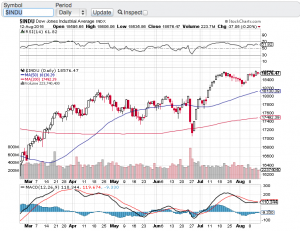
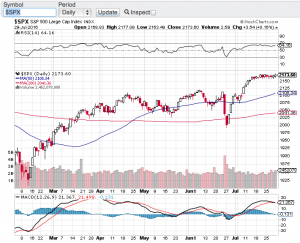
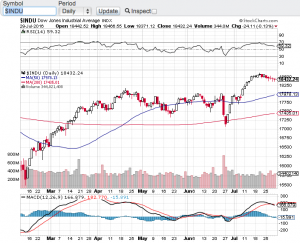
Actually quite the contrary! In fact new all time highs occurred this past week with the S&P 500 (see chart below), the Dow Jones Industrial Average (see chart below) and the Nasdaq (chart, click here). What’s more is these record closing highs of the aforementioned indexes occurred on the same day last week, a feat that has not happened since the bubble of 2000. Now I am not suggesting we are in a bubble like we were in dot-com days. Back then valuations of dot-com stocks and most of technology were rather insane. That said, the current price to earnings ratio of the S&P 500 is in the 20’s which is historically high. That alone could be a catalyst for a pause and consolidation and/or a pullback from the record high territory we have been trading in.

I am almost frightened to think or suggest that a retracement of any type is forthcoming simply due to the way the markets have been trading in a typically weak market season. As mentioned in my previous blog, August tends to be one of the weakest months of the year for the stock market. There is still a couple of weeks left in August and it is not too late to see historic trends surface. However, the way stocks have traded lately and with no real economic or geopolitical catalysts in the foreseeable future, this market melt-up may indeed continue.

Technically speaking, the trend lines of the 20-day, 50-day and 200-day moving averages all remain in tact and are yielding upward and the relative strength index of the key averages are not officially in overbought territory. So this is enough for me to not really expect much out of the market in either direction as we head into Labor Day weekend and as the summer winds down. Good luck to all 🙂

~George

S&P chart george mahfouz jr

dow jones chart george mahfouz jr

Is It Time For A Breather?

Stocks have been on a tear since the end of June with the key averages gaining close to 10% or more since coming off of their late June lows. That’s right double digit gains in a little over a month lead by the Nasdaq (chart) which is almost up 13%, followed by the small-cap Russell 2000 (chart) up 12.35% and both the S&P 500 (see chart below) and the Dow Jones Industrial Average (see chart below) closing up nearly 10% in that same time period. Part of the reason why the tech focused Nasdaq has led the charge is the stronger than expected and recently announced quarterly earnings results out of Amazon (NasdaqGS: AMZN) Apple (NasdaqGS: AAPL), Facebook (NasdaqGS: FB) and Google aka Alphabet (NasdaqGS: GOOGL).

So the question now is after such dramatic double digit gains in the aforementioned indices and in such a short period of time, is it time for a pause and/or a retracement? As you all know by now, the first thing that I look at when it comes to accelerated gains in any stock or index is the relative strength index also known as the RSI. The relative strength index is a technical indicator to determine overbought or oversold conditions, click here  for the complete definition. The RSI is also one of the favorite technical indicators used by market technicians, certain money managers and even select algorithms have the RSI programmed into their model. That said, the Nasdaq has now hit the 70 value level of the RSI which is an overbought level according to the RSI while the other key indices are not too far behind. Please note that indexes and stocks can remain overbought for extended periods of time.

So what does all of this mean? Well I think the set-up now is a little spooky. Not only are we at or approaching overbought conditions according to the relative strength index, but we now find ourselves in the month of August. August historically tends to be one of weakest month of the year for equities. In fact, over the past seven years the key indexes have fallen each year during this time period. History doesn’t always have to repeat itself, but the current set-up bodes well for a softer month ahead. We will see. Good luck to all 🙂

~George

S&P 500 George Mahfouz Jr

Dow Jones Chart George Mahfouz Jr