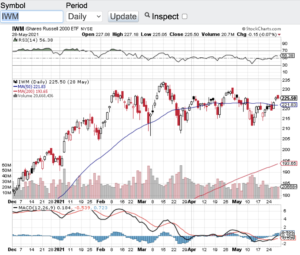
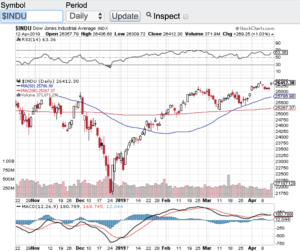
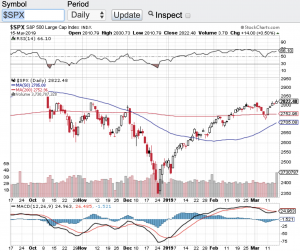
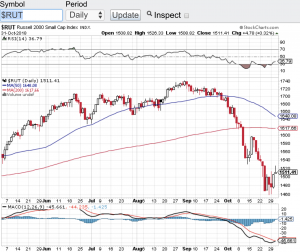
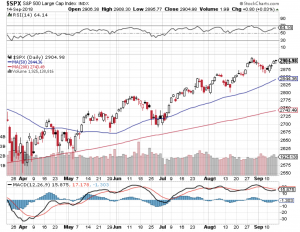
Risk On Remains On!

Risk on in the markets remains on as we approach the second half of the year! It’s truly remarkable to me how stocks, crypto, real estate and other asset classes are still trading at or near all time highs. I do get that the ongoing accommodative policies provided by our Federal Reserve and from central banks across the globe is the main reason why asset prices continue their bullish ways.

That said, I do think it is time to start considering how things could look once the Federal Reserve in our country starts backing away from its accommodative monetary policies and as interest rates begin to normalize. This is not a question of if, it’s a question of when. Tell tale signs of inflation are now seemingly everywhere which is what the Federal Reserve is paying close attention to and could be the catalyst for the Fed to act. It is at this point our markets could be adjusting to align with real interest rates and normalized price to earning multiples. To that end, we have and continue to witness the most unique market conditions ever seen. So I am not calling a top here and I do respect the power of the Federal Reserve, however, I am just suggesting that we may see a healthy and overdue adjustment in asset prices which may not be such a bad thing. There are many investors that are on the sidelines and would be more than happy to step in should we see asset prices adjust to a lower entry point.

Let’s take a quick look at the technical shape of the major averages. The Dow Jones Industrial Average (see chart here), the S&P 500 (see chart here), the Nasdaq Composite (see chart here) and the Small Cap Russell 2000 (see chart below) all are trading above their 20, 100 and 200 day moving averages. This alone is a strong technical backdrop and what’s more is none of the aforementioned indexes are currently overbought according to the relative strength index aka the RSI. So technically speaking things look pretty good right now.

Good luck to all πŸ™‚

~George

Risk On Remains On - Paula Mahfouz


Will Earnings Take The S&P To All Time Highs?

Now that earnings reporting season is upon us, will Q1 corporate earnings take the S&P 500 (see chart here) to all time highs? We are about to find out. For the first time in months the S&P 500 (see chart here) closed above the 2900 mark and is now within striking distance of its record close of 2940 set back in September. Once again the markets feel like they are in melt up mode. The Dow Jones Industrial Average (see chart below) closed on Friday at 26412 just 500 points away from its record high, the Nasdaq Composite (see chart here) is approaching the 8000 level a level it hasn’t seen in months, and last but not least the small-cap Russell 2000 (see chart here) is approaching the 1600 level and trading above its 200-day moving average.

The technical shape of the markets also appear to be healthy heading into Q1 earnings reporting season. All of the aforementioned indexes are trading above their 20-day, 100-day and 200-day moving averages. A good sign. Furthermore, none of these averages are in overbought territory this according the the relative strength index. Yet, another good sign.

Back to Q1 earnings reporting season. Although analysts and market pundits expect corporate earnings to have declined this quarter, I will be paying attention to the guidance that companies give. It’s no secret there has bee a global slowdown lately due to a variety of factors. However, if companies give better than expected guidance, then most likely we should indeed see new record highs.

Companies to look out for this week that are reporting are, Citigroup (NYSE: C), Goldman Sachs (NYSE: GS), Bank of America (NYSE: BAC), Johnson & Johnson (NYSE: JNJ), Netflix (NasdaqGS: NFLX), United Continental Holdings (NasdaqGS: UAL), Abbott Labs (NYSE: ABT), Alcoa (NYSE:AA), Las Vegas Sands, Corp. (NYSE: LVS), PepsiCo, Inc. (NasdaqGS: PEP), American Express (NYSE: AXP) and Honeywell International (NYSE: HON) just to name a few. Let’s see if Q1 earnings reporting season becomes the catalyst for new record highs. Good luck to all πŸ™‚

~George

Dow Jones Industrial Average - Paula Mahfouz


Is A Retest In The Cards?

Stocks apparently want to move higher and now the question comes to mind is a retest of the all time highs in the cards? Well if you look at the S&P 500 (see chart below) it sure seems so. The S&P 500 (chart) is at the earliest stages of technically breaking out of a 4 month trading range. Back in early November and again in early December the S&P flirted with the 2800 level before failing that level each time. In fact, in early December when the S&P tried to break the 2800 level not only did it fail to break through, it also went on to hit multi-year lows by the end of December. This is the time period where the bears started to growl and predict that stocks would continue to fall. Fast forward to today and not only did stocks reverse course since that late December sell-off, but now the key indices appear to be on the verge of breaking out. The Dow Jones Industrial Average (see chart here) also has bounced off its multi-year lows in December and is trading above its key moving averages, the Nasdaq Composite (see chart here) from a technical standpoint is also on the verge of breaking out, however the small-cap Russell 2000 (see chart here) has work to do to reclaim its 200-day moving average.

So what does all this technical jargon mean? It’s no secret the markets trade in algos and bots. Many of these algorithm trading platforms are programmed to certain technical indicators i.e. the 20-day, 50-day, 100-day and 200-day moving averages and/or the relative strength index aka the RSI. Furthermore, in many instances when the key indices are setup at a breakout level such as where the S&P 500 (see chart here) and the Nasdaq Composite (see chart here) find themselves at, momentum traders also come up to the plate and act. So we could very well indeed see the markets make a run to retest the all-time highs. Paula and I wish everyone a safe and Happy St. Patricks Day!

Good luck to all πŸ™‚

~George

S&P 500 - George Mahfouz Jr

A Long Overdue Correction!

It was a spooky time for the equity markets in October as stocks experienced a long overdue correction. You have to go back seven years to have a month that sold off in the way the markets behaved in October. Yes, historically October has been one of the most volatile months of the year. The problem with historical data over the past several years is most of the time history has NOT repeated itself. Stocks have been on a tear for years breaking record after record. In fact not that long ago all of the major indexes had set all time record highs. Fast forward to today and we find the Dow Jones Industrial Average (chart) down almost 7% from its recent all-time high, the S&P 500 (chart) actually fell at one point over 10% from its all-time high finishing the month of October down 8%, the Nasdaq Composite (chart)Β  is down over 10% from its recent all-time high and the small-cap Russell 2000 (see chart below) is off over 13% from its all-time high recorded on August 31st of this year. So I think it is safe to say most of the market is in correction mode.

Next question, is this a healthy correction for the markets and will stocks find their bottom here or could this be the start of our first bear market in a decade? I guess the answer depends upon who you ask. I think it is too early to call out that a bear market is in the making, but one thing is for sure, we have not seen sustained volatility as we have witnessed recently in a very long time. As long as the trade war rhetoric continues to spew out of Washington and as long as the Federal Reserve keeps its foot on the gas pertaining to interest rates, I think the wild swings and volatility will continue. Oh yea, there is also this small event next week called the “mid-term elections” which should also play a key role in continuing vol. Good luck to all πŸ™‚

~George

Russell 2000 - Paula Mahfouz

Traders And Investors Are Awaiting A September Selloff…

Traders and investors are awaiting a September selloff that actually may not come. Stocks continue to demonstrate strength and resiliency despite the political turmoil in Washington DC, rising interest rates and a seasonality headwind that just isn’t happening. August and September are typically weaker months for the stock market, instead the S&P 500 (see chart below), the Nasdaq Composite (chart) and the small-cap Russell 2000 (chart) hit all-time record highs and the end of August and despite a mini pullback shortly thereafter, the markets appear to have stabilized near all time highs. The Dow Jones Industrial Average (chart) did not make an all-time high in August, however, this index remains within striking distance of its all time high. The pundits are speaking to the strength of corporate America where earnings and profits are at their highest levels in decades as to the reason why the markets are not selling off. What is undeniable is that any time stocks have experienced a pull back it has been met with support from institutional investors and retail investors alike.

Speaking of support, let’s take a closer look at the technical shape of the aforementioned key indexes. Let’s start with the S&P 500 (chart). After pulling back to its 20-day moving average the S&P is right back at a breakout point. Next week we should see if the S&P can indeed breakout or fail and head back to its 20-day. The Nasdaq Composite index (chart) has similar chart pattern although it traded a bit below its 20-day support line for a few days before recapturing its 20-day and is now trading above it. A look at the Russell 2000 (chart), it too closed above its 20-day moving average and last but not least the Dow Jones Industrial Average (chart) also closed above its 20-day and this index is also right at a breakout or breakdown point. These bellwether indexes are also not in an extreme overbought condition according to the Relative Strength Index. The RSI tracks overbought or oversold conditions and is a momentum indicator that measures the degree and velocity of recent price changes to determine what is overbought and what may be oversold. We are simply not in any extreme condition according to the RSI principle.

Let’s see how the back half of September plays out and we will revisit the technical set-up of the markets in October. Good luck to all πŸ™‚

~George

S&P 500 - George Mahfouz Jr


An Earnings Bonanza!

Earnings reporting season is now in full swing and so far the numbers are not too shabby. A couple of earnings standouts so far are Netflix (NasdaqGS: NFLX) and Boeing (NYSE: BA). Netflix saw subscriber and revenue growth both exceed analyst’s expectations and their stock has skyrocketed since their earnings release last week. Boeing which reported before the bell yesterday also knocked the cover off the ball as the company nearly doubled its net income from the prior period a year ago. A company doubling its net income may not sound like a lot, but when you go from $1.63B in net income to $3.13B that is clearly moving the needle in a fascinating way. Boeing shareholders were also rewarded yesterday as the stock traded north of $350.00 per share hitting all-time highs. I am just highlighting a couple of standouts so far with hundreds of companies set to report over the coming days and throughout the next few weeks.

After a 2 day mini sell-off to start the week the key indexes did bounce back yesterday and resumed itsΒ  uptrend. The Dow Jones Industrial AverageΒ (chart) closed the month of January above 26,000, the S&P 500 (chart) closed out the month at 2823.81, the Nasdaq Composite (chart) closed at 7411.48 and the small-cap Russell 2000 (chart) closed at 1575. Even with the first noticeable sell-off earlier in the week the aforementioned indexes did have a stellar performance in January gaining more than 5% on the month.

I will say this, earlier in the week and for the first time in almost 2 years the market did feel vulnerable and the sell-off felt a bit different than recent pullbacks. Pundits are suggesting that interest rates may be playing a role in the volatility for the first time in years. I have been tracking the yield on the U.S. 10 year Treasury Note (Symbol: TNX) and for the first time in a long time the yield exceeded 2.7%. A break above 3% for an extended period of time could cause volatility to continue in stocks and may be the very first catalyst to put the brakes on this almost decade long bull run. Let’s see how the rest of earnings reporting season plays out and how interest rates fare in February before we can draw any type of conclusion. Good luck to all πŸ™‚

~George

Big Time For Big Tech!

Large cap tech stocks have taken center stage this earnings reporting season big time! Absolute blowout earnings reports came in from Amazon (NasdaqGS: AMZN), the parent company of Google, Alphabet (NasdaqGS: GOOGL) and the elders of the group Intel Corp (NasdaqGS: INTC) and Microsoft (NasdaqGS: MSFT). These tech titans are the latest reason for the Nasdaq (chart) and S&P 500 (chart) to reach and close at record highs yet again. The Dow Jones Industrial Average (chart) and the small-cap Russell 2000 (chart) are also within striking distance of their all times highs. Market observers have attributed the strength in stocks this year to a continuing low interest rate environment and the upcoming new tax policy from the Trump administration. This I get, however, no one can deny the growth that is happening in the tech world as well as other sectors of the economy.

The one note of caution I have here is the exuberant environment we find ourselves in with record highs happening weekly and in some instances daily. Yes earnings reporting season so far has been stellar but let’s not forget that we have not seen price to earnings ratios this elevated in quite some time. The question that now comes to mind are the markets and the aforementioned stocks finally at fair value? Especially as the p/e’s increase and as we approach a much higher interest rate environment over the next two years. We have been in such an accommodative monetary state for almost a decade which without a doubt has been the catalyst for equities and indexes and now the federal reserve here in the U.S. is reversing course. One of the groups that get the most affected in a higher interest rate environment are growths stocks like the aforementioned tech titans.

I am not suggesting that these stocks will not continue their upward trajectory, but I am making note and will be paying closer attention to the overall price to earnings ratios of the indexes and of high growth stocks in general as p/e’s continue to elevate. Good luck to all πŸ™‚

~George

Is Gold Breaking Out?

It certainly appears that way. Gold (see chart below) has caught a meaning bid as of late and it’s about time. The yellow medal has been stuck in a trading range between $1200 and $1300 per ounce for months and now has broke through the $1300 level currently trading around $1330 per ounce. What has surprised me is how long it took for gold to finally go from the left side of the chart to the right. Especially considering the geopolitical risk environment we find ourselves in. That said, stocks are saying what risk? As I write this blog, the Dow Jones Industrial Average (chart), the S&P 500 (chart), the Nasdaq (chart) and the small-cap Russell 2000 (chart) once again are all approaching all time highs. This after a very modest pullback in August. So Wall Street continues to remain in the “buy the dip” mood. All year long and every single time stocks experience any type of pullback, buyers come in and lift the markets to all time highs.

How long can this last? From a technical standpoint the key indices remain below the 70 value level of the relative strength index also referred to as the RSI. The RSI is used as a gauge by certain market technicians to see if whether or not stocks in the short term are overbought or oversold. As as these indexes approach all-time highs and should they breakthrough those highs, these markets can and should continue to go higher. However, if they do not breakout here, then one could expect yet another pullback especially as we are now in one of the more underperforming months for equites of the year. Historically September and October for that matter tends to be a difficult time for the markets. However, based on what we have witnessed all year long despite the ongoing geopolitical risks and with interest rates on the rise, the markets may not care about the seasonality trends of September and October. Good luck to all and both Paula and I wish everyone a safe and relaxing Labor Day Weekend πŸ™‚

~George

Gold chart - Paula Mahfouz