All-Time Highs Once Again!
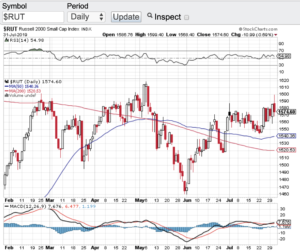
Stocks and key indexes hit all-time highs once again! The S&P 500 (see chart here) and the Nasdaq Composite (see chart here) hit record highs yesterday. It’s astonishing to me that despite the current geo-political backdrop, the continuing uncertainty from the tariff’s initiative and the political jockeying that is a constant, two of the key indexes hit all-time highs yesterday. However, the Dow Jones Industrial Average (see chart here) and the small-cap Russell 2000 (see chart here) still have work to do before they see their new all-time highs. That’s if they see their all-time highs.
In the past I have seen parabolic moves when major averages or individual stocks go up day in and day out. There are a lot of factors as to why prices go to extremes and here are a couple of examples; there is what is called “the fear of missing out” from retail investors where retail investors try to ride the trend and, in some cases, blindly. Another example is from an institutional standpoint and that is a term that is called “painting the tape”. Painting the tape refers to institutional money managers bidding up stocks into the end of a quarter, so their books reflect an even higher positive return and the end of a given quarter. Whatever the case may be, this is yet another impressive rally that we have witnessed despite all the market headwinds I spoke to above.
As I look ahead here in July there is so many different dynamics that will unfold that will certainly impact the markets. Let’s start with the Q2 earnings reporting season. Now that the 2nd quarter of the year has concluded, companies will start reporting their Q2 earnings results here in July. No question once earnings reporting season begins investors will be watching and listening closely as to how corporate America’s earnings are being impacted by the newly issued tariffs. I am expecting a cautionary tone from these companies as their CFO’s begin to model in how the tariffs will adjust their future forecasts. Then we have the geo-political backdrop and the uncertainty there, especially now with the new Iran – Israel conflict. Finally, there is a bill in Washington that is being debated as I type, who knows how that will end up?
I think it is safe to say that we are going to be in for a wild ride in the coming weeks and months. Good luck to all 🙂
~George