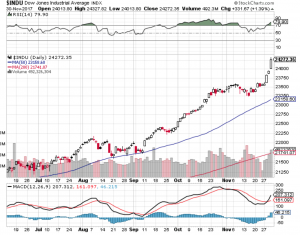
Dow 24,000 – Bitcoin $10,000 – Why Not?

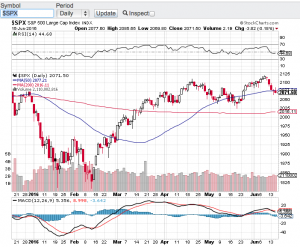
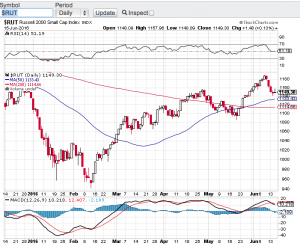
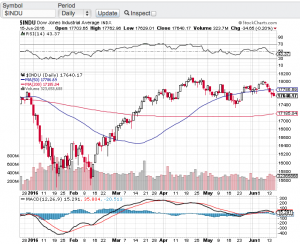
Is this really happening? Stocks exploded to the upside on the last trading day of November. For the first time in its history, the Dow Jones Industrial Average (see chart below) traded, blew through and closed above the 24,000 mark. The Dow started the year just under 20,000 and no one and I mean no one in the who’s who of finance, analysis, technical analysis, hedge funds, institutional investors and the like, ever predicted this type of performance for stocks and the key indices on the year. I cannot even count the number of record highs that have occurred this year not only in the Dow Jones Industrials, but also the S&P 500 (chart), the Nasdaq composite (chart), and the small-cap Russell 2000 (chart). Let’s throw in Bitcoin and its year to date 10X performance and we are truly in party mode.

I am not even sure what to think? This eerily feels like the irrational exuberance environment that occurred in the mid to late 90’s and before the internet bubble imploded. However the bullish pundits are quick to point out that this time is different. Back then, whoever came out with an announcement that they just launched a website saw their stock go up. Now the pundits are pointing out that it is earnings and growth that are responsible for this torrid record setting pace we have been on all year long. This is true to some degree. But what about the euphoria in Bitcoin? What is the catalyst that has propelled this so call asset to fly up over 10 times this year? This is why the other side of the camp thinks we are approaching a bubble or at the very least nose bleed territory. Without question I feel that something is going on that makes one have to pause and take a breather here. But as we have seen all year long, don’t underestimate the power of momentum, a low interest rate environment and the Trump trade. Is it possible that the Dow Jones Industrials actually could close above 25,000 by year end? As much as I want to say and think “no way”, way! Not saying the Dow will go up another 800 points by year end, but if we do, I would not be at the very least surprised.

Good luck to all 🙂

~George

Dow Jones Industrial Average - George Mahfouz Jr

Solid Gains In Q1!

The major averages closed out the first quarter of the year posting solid results. The Dow Jones Industrial Average (chart) closed up 4.6%, the S&P 500 (chart) closed up 5.5%, the small-cap Russell 2000 (chart) gained 2.1% and the technology focused Nasdaq (chart) finished out the first quarter of the year up an eye-popping 10%. It’s no surprise how well tech did in Q1 considering how much this sector sold off after Trump won the election.

Although stocks continue to outperform, there has been some uncertainty coming into backdrop. The GOP’s inability to pass Trumpcare was the first sign of the potential breakdown of the new administration’s policies. Investors are beginning to wonder whether or not there will be more divide amongst republicans and how that could affect the upcoming tax reform bill. If there are any snags there or if that reform does not pass, some market pundits believe a 10-20% correction could occur.

Here are my thoughts about that. I do agree that if the proposed Trump tax reform does not go through, there indeed could be an immediate market reaction to the downside. How much, who knows? The markets are seemingly priced to perfection and then some. So if corporate tax rates are not reduced as Trump and his administration has outlined, why wouldn’t stocks be affected? Of course we will not know until late summer how the administration’s new tax policy will look like in its final state or whether or not it will even pass.

That said, there is plenty of runway between now and then for stocks and this starts with first quarter earnings reporting season. April is the month in which companies begin to report their earnings results to their shareholders. Corporate profits appear to be growing along with the economy. This my friends is where investors should be valuing stocks. So much emphasis has been put on the new administration’s economic and tax reform policies that we need not to forget about what really matters and that is corporate profits. That is not to say that government polices including the Federal Reserve don’t matter, but at the end of the day and when all the votes are in, growth and profits to me is what truly matters when valuing and investing in stocks.

Good luck to all 🙂

~George


Looks Like A Double Top…

A recent attempt to breakout to all-time highs has seemingly failed. The Dow Jones Industrial Average (see chart below) , the tech-focused Nasdaq (see chart below), the S&P 500 (see chart below) and the small-cap Russell 2000 (see chart below) all appear to have “double topped” and have retreated to support lines. Without question growth concerns here in the United States are abound. These concerns escalated right after the release of May jobs report which was dismal to say the least. Couple these concerns with the potential of the United Kingdom leaving the European Union and its no wonder why the markets have pulled back over the past couple of weeks.

One of the risks to the markets that I highlighted in my last blog were interest rates. It appeared at the beginning of the month that the Federal Reserve and market pundits were all but certain that a rate hike would occur at today’s Federal Reserve meeting. Well thanks to the underwhelming May jobs report, no rate hike occurred this month and furthermore the Federal Reserve have lowered their outlook for any near term future increases! The Fed did say that they will be monitoring our economy and the data to guide them in their future policy decisions and sure enough they continue to stand by this protocol.

Now what? First for me, I want to see how the market reacts to next Thursday’s vote as to whether or not Britain leaves the European Union? Momentum does appear to be increasing for a British exit, which could lead to a global slowdown? Nobody knows if the referendum will pass or what type of effect this will have across the pond or here in the U.S. In the meantime, I will be monitoring the technical shape of our key indices and as you can see in the below charts each of these indexes have found support at either the 20-day, 50-day or 200-day moving averages.

Good luck to all 🙂

~George Mahfouz, Jr.

george mahfouz jr SPX chart

george mahfouz, jr Russell chart


george mahfouz jr Dow chart

george mahfouz jr nasdaq chart

First Quarter In The Books…

Q1 proved to be a mixed bag for the major averages. The Dow Jones Industrial Average (chart) closed out the first quarter up almost 1.5%, the S&P 500 (chart) finished up 0.77%, however, both the Nasdaq (chart) and the small-cap Russell 2000 (chart) finished out the first quarter of the year lower by 2.75% and 1.78% respectively. Not too shabby considering these key indices were down over 10% earlier in the quarter. This morning stocks are lower despite a stronger than expected  jobs report. In March, the economy added 215,000 jobs with the unemployment rate now at 5%.

With Q1 in the rear view mirror all attention will now be focused on first quarter earnings reporting season. The Commerce Department recently issued a report indicating that corporate profits were down 15% year-over-year. This does not bode well for stocks when the current p/e ratio’s of the major averages are well above their historic averages. With earnings reporting season just ahead, we will not have to wait too much longer to see how well corporate America is doing.

Let’s take a quick look at the technical shape of the markets. Most of the key indices are at or near overbought conditions, which has been the case for pretty much most of March. In my previous blog I eluded to what most market technicians look at when gauging overbought or oversold conditions. Furthermore and technically speaking, the major averages are all trading at or above their 20, 50 and 200-day moving averages with only the small-cap Russell 2000 (chart) chasing its 200-day. If you are bullish on the market, these moving average patterns are typically a good thing. That said, I do expect volatility to pick up a bit which is usually the case ahead of earnings reporting season. I will check back in mid-month or so to see how earnings growth actually appears.

Good luck to all 🙂

~George

Stocks Skittish Before The Fed Meeting…

Stocks have become hesitant as to which direction to head into with all eyes now on whether the Federal Reserve will raise interest rates this week for the first time in almost a decade. The Dow Jones Industrial Average (chart) started the week down 62.13, the Nasdaq Composite (chart) closed Monday’s session out down 16.58, the S&P 500 (chart) fell 8 points and the small-cap Russell 2000 (chart) closed modest lower by 4.3 points.

As investors and traders await the decision from the Federal Reserve as to whether or not a rate increase will occur, I think the markets are putting too much emphasis on the initial hike, regardless if it’s announced after the conclusion of their two-day meeting this week. To me what’s more is how will the Federal Reserve respond over the coming months and quarters ahead? Shouldn’t we be more attuned to their behavior pattern after the first hike? Or whether or not they will raise rates at an accelerated rate? To me this is the bigger question. Of course a quarter point rate hike or even a 50 basis point hike is in the cards and is inevitable at some point in time, whether it’s this week or at the Federal Reserve’s future meetings. My focus and attention will be on how they treat the interest rate environment after the first rate hike actually occurs. Based on the temperament and demeanor of Janet Yellen, I would expect a continuing cautious protocol from our Fed Chair and I would think that neither she or the Fed would not be inclined to raise rates too fast. I would think the economic data would dictate the velocity of future rate hikes and even if the data becomes robust, the Federal Reserve would want to see multiple quarters of meaningful expansion before we get back to normalized rates.

That said, I do think that the markets and investors are going to need to get used to increased volatility and market swings similar to what we have been experiencing over the past few months. I believe gone are the days of low vol and indeed investors are going to need to pay attention now more than ever to the true growth rates of companies, especially on the top-line. You see in a rising interest rate environment companies can no longer grow their bottom line alone while maintaining high valuations. Real growth needs to come forward in the form actual sales expansion in addition to productivity in order for companies to maintain elevated P/E multiples. Bottom line, you better know the companies you choose to invest in because the free lunch so to speak that the markets, investors and traders have enjoyed over the past several years may come to a close in the near future…

Good luck to all 🙂

~George

As Expected, New Market Highs Continue…

In my previous blog, I eluded to the notion that the bulls would remain in charge for the foreseeable future and sure enough, in charge they are. Last week, the Dow Jones Industrial Average (chart), the S&P 500 (chart), and the small-cap Russell 2000 (chart) all hit record highs while the Nasdaq (chart) continues to gravitate toward the 5000 level. This market has no quit. With the majority of the S&P 500 companies reporting their Q1 earnings, overall earnings growth was relatively good, topping expectations. Meanwhile, Fed Chair Janet Yellen stated at her biannual meeting with the Senate Banking Committee that the Fed will be patient before any change in interest rate policies and that guidance would be given prior to any such action. This, along with the no real surprises coming out of earnings reporting season and the U.S. labor market showing a continuation of job growth, without question has played a role in the continuing strength of the U.S. stock market.  

Okay, all clear right? Well, we all know there is always the other side to the story and markets do not go up in a straight line forever. Without many upcoming catalysts in March, or in any given time period where catalysts are few, I always refer to the technical shape up of the markets to see if overbought or oversold conditions exist. As you all know by now, one of my favorite technical indicators to gauge whether or not the markets are in extreme conditions, is the Relative Strength Index. If you go back historically and look at the RSI indicator of any given stock or index, you too can see the reliability of this particular indicator when it reaches overbought or oversold conditions. Click on this link to get the definition of the RSINow I am not saying to completely base trading or investment decisions off of this technical indicator or any other technical indicator for that matter. However, for me personally this has proven to be a trusted guide and I do include this analysis when viewing the current market environment. That said, we are beginning to look a little overbought and I am going to look for pullbacks before I entertain any new positions in equities. Good luck to all and I wish all a very prosperous month 🙂

~George

Record Close! Sure Doesn’t Feel Like It…

The Dow Jones Industrial Average (chart) ended the month of April at a closing record finishing at 16,580.84. The Nasdaq (chart) closed the month out down 2%, the S&P 500 (chart) finished the month slightly up and the small-cap Russell 2000 (chart) lagged the markets closing down 4% at 1,126.85. Stocks have see-sawed all year long which is why for me, it does not feel like a record close. Another reason why we don’t feel like we are in record territory is we are seeing a lot of momentum stocks begin to lose their mojo, in particular Amazon (NasdaqGS: AMZN), Netflix (NasdaqGS: NFLX) and biotech momentum favorite Biogen Idec (NasdaqGS: BIIB) just to name a few.

That said, as Q1 earnings reporting season continues, companies continue to produce better than expected profits for the most part, which is one of the reasons why stocks have shown impressive resilience. The vitality of corporate America is quite remarkable considering the paltry 0.1% annualized growth rate our economy experienced in the first quarter. So now that we are in May, will the old adage “sell in May and go away” apply this year? I am not so sure. Let’s not forget interest rates remain near record lows, the Fed is still buying bond assets to help stimulate the economy albeit at a slower pace, and the technicals of the market are not in bad shape.

Let’s take a gander at the current technical setup of the aforementioned key indexes. The two technical indicators I pay the closet attention to is the Relative Strength Index a.k.a. the RSI, and the moving averages. Out of hundreds of technical indicators available, I have found that these particular indicators work the best for me. In technical analysis, I like to keep things simple and not place too many indicators into the mix. It also helps that certain high profile market technicians, computerized trading models and certain institutional investors utilize the RSI and moving averages as their core technical indicators in their trading models.  Time and time again when I see that the Relative Strength Index (RSI) of a given index or equity is in an overbought or oversold condition, the majority of the time the asset or index reverts back to the mean. Typically the same rings true with the moving averages, whenever a stock or index bumps up against or comes down to its moving average, typically the stock or index finds support or resistance. Let’s break this down in more detail. Pertaining to the (RSI), The RSI is designed to demonstrate whether or not an index or stock is overbought or oversold, depending on certain value levels. According to the RSI principle, the 70 value level or greater, is an overbought condition and the 30 value and below is an oversold condition. As of right now, the aforementioned indices are hovering around the 50 value level +/- which is not indicating an extreme condition either way. Looking at the moving averages, of these four indexes, 2 of the 4 remain above their 50-day and 200-day moving averages and as you can see with the small-cap Russell 2000 (chart), this index has recently been finding support and bouncing off of its 200-day moving average, which clearly demonstrates the powerful support that moving averages can provide.

So again, I am not so sure if the “sell in May and go away” will apply this year based on how the technical set-up appears, how corporate America is coming in with their surprising earnings report cards and a continuing accommodative Fed. Good luck to all and happy trading in the month of May 🙂

~George