Triple Top Or Breakout?

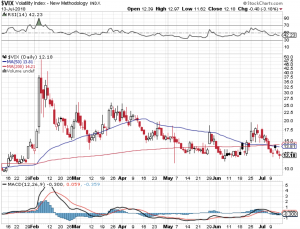
After chopping between the 2700 and 2800 zone for the past couple of months, is the S&P 500 (chart) at a triple top, or is it ready to breakout? I think we are going to find out this week in which second quarter earnings reporting season kicks into high gear. Although volatility has reared its head in first half of 2018, vol now has come back to what the markets have been accustomed to over the past few years (see chart below). Whether we breakout and test all time highs is a head scratcher. Of course earnings will play a key role in which way the markets will go, but there are other market moving factors in the mix. Any minute President Trump could put out a tweet on trade which could kill the most recent rally in stocks or propel it to new highs. On Tuesday and Wednesday, Federal Reserve Chairman Jerome Powell will speak in front of the Senate Banking Committee and the House Financial Services Committee. Without a doubt investors will be paying close attention to the tone and context of Chairman Powell’s testimony in front of both committees. Oh yes, we must not forget the Trump/Putin summit and I can’t even guess what comes out of that meeting and how the markets will react. So as you can see, chance are we will breakout of the triple top we are in or pullback within the trading range as mentioned above.

This week kicks off with high flying Netflix (NasdaqGS:NFLX) which reports their quarterly results tomorrow after the close, followed by Goldman Sachs (NYSE: GS) on Tuesday along with Johnson & Johnson (NYSE: JNJ), T-Mobile (NYSE: TMUS) and rounding the week out we will hear from the likes of Alcoa Corp (NYSE: AA), American Express (NYSE: AXP), eBay Inc. (NasdaqGS: EBAY), International Business Machines (NYSE: IBM), Etrade Financial Corp. (NasdaqGS: ETFC), Intuitive Surgical (NasdaqGS: ISRG), Microsoft Corp. (NasdaqGS: MSFT), General Electric (NYSE: GE) and Honeywell International Inc. (NYSE: HON) just to name a few. Good luck to all 🙂

~George

VIX - George Mahfouz Jr.

2 Percent – That’s It?

What should of been at least a 5-10% correction last week, the major averages barely flinched. This despite North Korea incessant threats of a nuclear attack against the U.S. and President Trump’s response that “fire and fury” will be unleashed by the U.S. in such an event. I am truly in disbelief that the markets did not take this geopolitical risk to correct in a more meaningful manner. In fact stocks yesterday had their best single day of the summer. Now we find ourselves yet again near all time highs. The Dow Jones Industrial Average (chart) closed just shy of 22,000, the S&P 500 (chart) is just under its all-time high of 2490, the Nasdaq (chart) closed at 6430 and the small-cap Russell 2000 (chart) closed Monday’s session at the 1395 level.

Talk about passive, machine driving algorithmic trading. One thing that really stands out to me is how the S&P 500 (chart), Nasdaq (chart) and the Russell 2000 (chart) all held their major moving average support lines. In particular the S&P and Nasdaq’s 50-day MA and take a look how powerful the Russell 2000’s 200-day moving average held and bounced (chart). It is clear that program trading models worked to perfection on this recent market pullback at least pertaining to key technical support levels.

So are we out of the woods pertaining to the risk trade? I am not so sure. But my goodness how can anyone have any kind of short thesis on these markets. Not even the heightened and continuing threat of a nuclear attack can rattle these markets more than 2 percent. Now that the rhetoric coming out of North Korea has abated for now, it could be business as usual as traders and investors get back to focusing on corporate earnings and fed policy. Whatever the case is I continue to be baffled by the strength of the U.S. stock market and without a doubt the old adage “don’t fight the tape” couldn’t be more true this year.

Good luck to all 🙂

~George

Dow 21,000 Are You Kidding?

This market is unbelievable! As I am writing this blog the Dow Jones Industrial Average (chart) has eclipsed the 21,000 mark. This after President Donald Trump’s first speech to the joint session of Congress. Not only has the Dow breached 21,000, the Nasdaq (chart) has also set a new record this morning at 5,875, the S&P 500 (chart) has set a new record of 2,384 and counting, the small-cap Russell 2000 (chart) has hit a new record high and even the Dow Jones Transportation Average (chart) has set a new record high this morning at 9567.

It’s been exactly one month since the Dow Jones Industrial Average (chart) topped the 20,000 mark and now catapulting through 21,000! It’s inconceivable that the Dow has tacked on yet another 1,000 points in a month. The bears must be in shock! I am not exactly sure what President Trump said last night that is any different from what he has already promised during his campaign and during his inaugural speech in January. One would think that the markets have already priced in the “huge” corporate tax cuts Trump has promised. Also, I thought that the markets have also priced in the proposed $1 trillion dollar infrastructure spend. One thing for sure, right now the markets don’t care about valuations or the fact that it will take time for the Trump administration to figure out if the tax cuts or infrastructure spend as promised will even occur as designed?

I like to close my blogs out with the current technical take of the indexes. Quite honestly, the technicians are also baffled about this tape. The Dow Jones Industrial Average (chart) remains in extremely overbought conditions as does the S&P 500 (chart). The Nasdaq (chart) just re-entered overbought territory according to the relative strength index and the small-cap Russell 2000 (chart) is heading in that direction. We are witnessing one of the strongest bull markets in history!

Good luck to all 🙂

~George