Record Highs Continue…

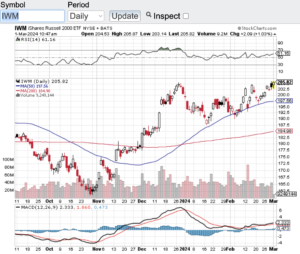
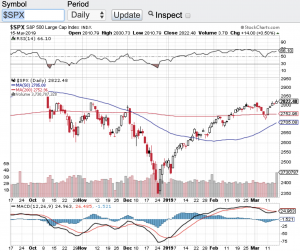
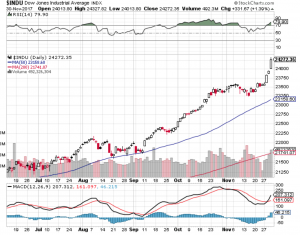
Record highs continue for the Dow Jones Industrial Average (see chart here) and for the S&P 500 (see chart here). In February, the Dow Jones Industrials hit an all-time high of 39282 while for the first time ever, the S&P 500 (see chart here) crossed the 5000 mark trading as high as 5111. These two indexes continue to demonstrate impressive strength along with the Nasdaq Composite (see chart here). It appears that the Nasdaq Composite just might join the Dow Jones Industrials and S&P 500 in hitting a fresh all-time high anytime. The small-cap Russell 2000 (see chart here & below) still has a way to go to reach its all-time high but at least this index is trending up.

Stocks aren’t the only asset class at or near all-time highs, Bitcoin has broken out as of late and has surpassed $60,000 per coin mark. The momentum continues here since Bitcoin ETFs were approved. Now this asset class in not for the faint of heart. As much as Bitcoin continues to rip, sell-offs in this asset class can be dramatic and fast.

So, what is going on with these all-time highs and the “risk on” spirit from institutional investors and retail investors alike? For one, I think the strength of the economy has something do to with this, however, I believe that rampant speculation is also play a role. Especially out of the artificial intelligence sectors as stocks there also continue to make all-time highs. My concern is how long this most recent rally has lasted. For example, the S&P 500 (see chart here) has seen gains in 15 of the last 17 weeks which is rarely seen.

With that being said, as I look at the technical shape of the aforementioned indexes, they are not in overbought territory according to the relative strength index aka the RSI. Many market technicians use this key technical indicator to gage whether a stock or index is overbought. 70 is the key value level of the RSI that would indicate an overbought condition and the major averages are trading below this mark. Now this is only one technical indicator and there are clearly many other factors that determine the state of the markets, but as of now nothing appears to be getting in the way of this impressive months long rally.

Good luck to all 🙂

~George

All Time Highs Continue - Paula Mahfouz

What A Month For Stocks!

What a month for stocks as the major averages rebounded sharply in July. After witnessing an incessant selloff over the past few months, July turned out to be the best month for stocks in years. After falling into bear market territory, the S&P 500 (see chart here) gained almost 10% last month cutting its year to date losses in dramatic fashion. As I look at the Dow Jones Industrial Average (see chart here) a thousand-point gain in the last week or so is not too shabby either. Last but not least, both the Nasdaq Composite (see chart here) and the small-cap Russell 2000 (see chart here) also has enjoyed a strong recovery from their recent lows.

So why was there such a strong performance in the month of July? Q2 earnings reporting season is in full swing and at best this Q2 earnings so far have been a mixed bag. The Fed last week also raised interest rates another 0.75%. Inflation remains at or near 40-year highs. So, if you solely look at these metrics one would think the recent selloff would be accelerating. Clearly this is not the case, yet! The bears would argue that this is an “oversold” bounce and part of me agrees with that. However, I think it is too early to say that we are back to a full-fledged bull market. I do think if the markets remain stable over the next couple of months this could be a sign of a bottoming process. Let’s see how the rest of the summer plays out.

Now let’s move over to the technical shape of the aforementioned indexes. What has caught my eye is how the major averages are either at or have recaptured their 100-day moving average. This important support and/or resistance line is key as to whether stocks will pause into the resistance that moving averages experience, or if the momentum continues, then this could mean that this latest bull run will continue.

Good luck to all 🙂

~George

Is A Retest In The Cards?

Stocks apparently want to move higher and now the question comes to mind is a retest of the all time highs in the cards? Well if you look at the S&P 500 (see chart below) it sure seems so. The S&P 500 (chart) is at the earliest stages of technically breaking out of a 4 month trading range. Back in early November and again in early December the S&P flirted with the 2800 level before failing that level each time. In fact, in early December when the S&P tried to break the 2800 level not only did it fail to break through, it also went on to hit multi-year lows by the end of December. This is the time period where the bears started to growl and predict that stocks would continue to fall. Fast forward to today and not only did stocks reverse course since that late December sell-off, but now the key indices appear to be on the verge of breaking out. The Dow Jones Industrial Average (see chart here) also has bounced off its multi-year lows in December and is trading above its key moving averages, the Nasdaq Composite (see chart here) from a technical standpoint is also on the verge of breaking out, however the small-cap Russell 2000 (see chart here) has work to do to reclaim its 200-day moving average.

So what does all this technical jargon mean? It’s no secret the markets trade in algos and bots. Many of these algorithm trading platforms are programmed to certain technical indicators i.e. the 20-day, 50-day, 100-day and 200-day moving averages and/or the relative strength index aka the RSI. Furthermore, in many instances when the key indices are setup at a breakout level such as where the S&P 500 (see chart here) and the Nasdaq Composite (see chart here) find themselves at, momentum traders also come up to the plate and act. So we could very well indeed see the markets make a run to retest the all-time highs. Paula and I wish everyone a safe and Happy St. Patricks Day!

Good luck to all 🙂

~George

S&P 500 - George Mahfouz Jr

Dow 24,000 – Bitcoin $10,000 – Why Not?

Is this really happening? Stocks exploded to the upside on the last trading day of November. For the first time in its history, the Dow Jones Industrial Average (see chart below) traded, blew through and closed above the 24,000 mark. The Dow started the year just under 20,000 and no one and I mean no one in the who’s who of finance, analysis, technical analysis, hedge funds, institutional investors and the like, ever predicted this type of performance for stocks and the key indices on the year. I cannot even count the number of record highs that have occurred this year not only in the Dow Jones Industrials, but also the S&P 500 (chart), the Nasdaq composite (chart), and the small-cap Russell 2000 (chart). Let’s throw in Bitcoin and its year to date 10X performance and we are truly in party mode.

I am not even sure what to think? This eerily feels like the irrational exuberance environment that occurred in the mid to late 90’s and before the internet bubble imploded. However the bullish pundits are quick to point out that this time is different. Back then, whoever came out with an announcement that they just launched a website saw their stock go up. Now the pundits are pointing out that it is earnings and growth that are responsible for this torrid record setting pace we have been on all year long. This is true to some degree. But what about the euphoria in Bitcoin? What is the catalyst that has propelled this so call asset to fly up over 10 times this year? This is why the other side of the camp thinks we are approaching a bubble or at the very least nose bleed territory. Without question I feel that something is going on that makes one have to pause and take a breather here. But as we have seen all year long, don’t underestimate the power of momentum, a low interest rate environment and the Trump trade. Is it possible that the Dow Jones Industrials actually could close above 25,000 by year end? As much as I want to say and think “no way”, way! Not saying the Dow will go up another 800 points by year end, but if we do, I would not be at the very least surprised.

Good luck to all 🙂

~George

Dow Jones Industrial Average - George Mahfouz Jr

As Expected, The Fed Raises Rates…

To no surprise, the Federal Reserve raised interest rates 1/4 point today citing stronger economic growth and a pick-up in inflation. A stronger job market also played a role in the decision of the Fed. What wasn’t quite expected was the language of an additional anticipated rate hike from the projected two hikes in 2017 to now three. This might of caused the slight sell-off yesterday in the markets with the Dow Jones Industrial Average (chart) falling 118.68 points, the S&P 500 (chart) was lower 18.44 points, the Nasdaq (chart) fell 27.15 points and the small-cap Russell 2000 (chart) retraced by 17.51 points.

With all things considered, this pullback was long overdue. In fact, I am surprised that the markets held up like they did yesterday. Especially considering the rip roaring rally most equities have enjoyed since the presidential election. Markets have been on fire with the Dow Jones Industrials (chart) gaining almost 1,600 points, the S&P 500 (chart) ripping 125 points, the Nasdaq (chart) catapulting about 300 points and the small-cap Russell 2000 (chart) up a staggering 170 points. What a breathtaking rally in such a short period of time.

So what can we expect between now and year end? Let’s think about this for a minute. If you are an institutional investor, fund manager, hedge fund or the like would you be taking profits into year end? Or would you wait until we get into the new year knowing that capital gains taxes and corporate taxes are coming down? I think it is fair to say the latter would make the most sense. Add into the mix the rotation that continues out of the bond market and into equities in which certain pundits believe we are in the fourth or fifth inning of that rotation, one has to ascertain that this bull market has more room to run.

Whatever the case I think pullbacks will be bought as momentum continues into year-end. Paula and I wish everyone the happiest and healthiest holiday season 🙂

~George

Strong Week For Stocks!

The major averages continue to show strength upon the launch of first quarter earnings reporting season. The Dow Jones Industrial Average (chart) closed the week up 1.8%, the Nasdaq (chart) also closed up 1.8%, the S&P 500 (chart) added 1.6% and the small-cap Russell (chart) 2000 led the charge by closing the week up a whopping 3.1%. The money center banks such as JPMorgan Chase NYSE: JPM (chart), Bank of America NYSE: BAC (chart) and Citigroup NYSE: C (chart) which reported their earnings late in the week did help continue the momentum we have recently seen in the markets.

The question now is can earnings reporting season which begin in earnest next week breakout this market to new highs? Companies that are scheduled to report next week are International Business Machines Corp. NYSE: IBM (chart), Morgan Stanley NYSE: MS (chart), Netflix NasdaqGS: NFLX (chart), Goldman Sachs NYSE: GS (chart), Discover Financial Services NYSE: DFS (chart), Intel Corp. NasdaqGS: INTC (chart), Intuitive Surgical NasdaqGS: ISRG (chart), Johnson & Johnson NYSE: JNJ (chart), TD Ameritrade Holding Corp. NasdaqGS: AMTD (chart), Yahoo! Inc. NasdaqGS: YHOO (chart), American Express NYSE: AXP (chart), Coca-Cola NYSE: KO (chart), Qualcomm NasdaqGS: QCOM (chart), Biogen NasdaqGS: BIIB (chart), E*Trade Financial Corp. NasdaqGS: ETFC (chart), General Motors NYSE: GM (chart), Microsoft Corp. NasdaqGS: MSFT (chart), Southwest Airlines NYSE: LUV (chart), Starbucks NasdaqGS: SBUX (chart), Visa Inc. NYSE: V (chart), American Airlines Group NasdaqGS: AAL (chart), Caterpillar NYSE: CAT (chart) and General Electric NYSE: GE (chart) just to name a few.

Without question the aforementioned earnings reports will play a significant role in whether the key indices will breakout to new highs or struggle at their current resistance levels. One other historic factor that can play into the mix is April tends to be one of the top performing months of the year. Whatever the case is, I think it’s safe to assume a breakout or possibly a breakdown is on the horizon. Good luck to all 🙂

~George

Nine in a row!

The Dow Jones Industrial Average (chart) closed at a record high notching its ninth day in a row of gains. A streak not seen since 1996. Furthermore, the small-cap Russell 2000 (chart) and the Dow Jones Transportation Average (chart) also closed at record highs. The S&P 500 (chart) is also a hiccup away from a record. The momentum and year-to-date gains in these markets are breathtaking, especially when you consider all of the potential headline risks here and abroad.

As a trader or investor it’s incredibly tempting and seemingly logical to commence a short position thesis right now as everyday a new record is being set. However, picking a top or getting in the way of this parabolic move can be painful and costly. Also, it is very difficult to initiate new long positions when everyone on the street knows at some point and time a pullback in equities will occur.

So what’s a trader do in this market environment? Personally, I look for individual names that may be experiencing a “one time” event which may create a buying or selling opportunity. For example let’s take a look at Spectrum Pharmaceuticals, Inc. (NasdaqGS: SPPI). Here is a company that lost over 37% of its value today and traded over 22,000,000 shares which represents almost half of its float. The plunge in the company’s shares were due to an unexpected forecast by the company indicating their full year revenue will decline dramatically over its core drug Fusilev. This news definitely caught the street off guard especially after the company had expected sales to rise this year.

So when I see a haircut such as the one Spectrum received today, I immediately look to the fundamentals to see if this is an over reaction, or if there is more downward pressure ahead. After taking a gander at the fundies, the one thing that stood out to me was the significant short interest in the stock. According to nasdaq.com, as of February 28th the short interest in Spectrum stood at a whopping 27,231,552 shares. This is almost 50% of the entire outstanding shares held short. Now who knows how much of the short position has covered since February 28th, or how many shares remain short? Of course, this is not the only metric I look at when considering taking action, but this particular metric most certainly stood out to me. What I have seen in the past with other scenario’s such as this, with such a large short position, and after a major sell-off such as the one Spectrum experienced today, at the very bare minimum some type of short covering rally typically ensues.

By no means am I suggesting to go long or short Spectrum or any other asset or index, what I am doing is highlighting the fact that in any macro-market environment whether its overbought or oversold, if you do your research and subsequent due diligence, there can be opportunities found long or short. That said, it is always best and in this environment required to consult a certified financial professional before considering any investment or investment strategy.

Have a good evening.

~George