Trying To Make Up Its Mind!

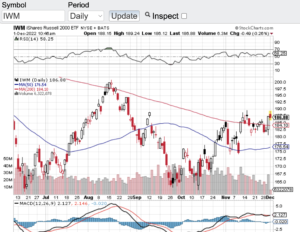
Seemingly, the markets are trying to make up their mind on whether to breakout or breakdown. Over the past couple weeks, the Dow Jones Industrial Average (see chart here), the S&P 500 (see chart here), the Nasdaq Composite (see chart here) and the small-cap Russell 2000 (see chart here and below) have all been consolidating in a very tight trading range. As you can see in the charts of these major averages, consolidation has occurred while also finding support at their 100 and 200-day moving averages. These tight trading ranges along with moving average support bodes well for an inevitable break from this current trading range . The question is will the markets breakout before year end or breakdown and through their respective moving averages support lines?

Let’s face it, we are currently in a bear market and rightfully so. It has been repulsive to see how inflated asset prices were during the heart of the pandemic. Stimulus was abound, interest rates remained at all-time lows and then speculation went from reasonable to very disturbing. This recipe set up the bear market and then Federal Reserve launched it by aggressively raising interest rates. My comment to that is what took them so long? The Fed had no choice to but to start raising rates and inflation took off to levels not seen in over 40 years. The silver lining to all the above is that finally we are moving towards a market that is now more trustworthy. Trustworthy from the standpoint that stocks may actually start trading at reasonable levels to where opportunities can be found. In fact, it is possible that certain stocks and sectors for that matter will overshoot to the downside to where great opportunities could come to the forefront.

As mentioned above, stocks are currently trading in a tight trading range and have support at their moving averages. However, with year-end approaching and as traders and investors reposition their portfolios I would not be surprised if we exit this tight trading range the markets have been in.

Good luck to all 🙂

~George
Is A Retest In The Cards?

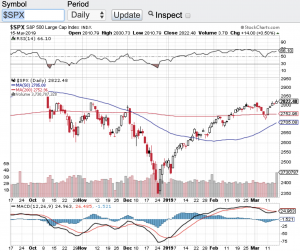
Stocks apparently want to move higher and now the question comes to mind is a retest of the all time highs in the cards? Well if you look at the S&P 500 (see chart below) it sure seems so. The S&P 500 (chart) is at the earliest stages of technically breaking out of a 4 month trading range. Back in early November and again in early December the S&P flirted with the 2800 level before failing that level each time. In fact, in early December when the S&P tried to break the 2800 level not only did it fail to break through, it also went on to hit multi-year lows by the end of December. This is the time period where the bears started to growl and predict that stocks would continue to fall. Fast forward to today and not only did stocks reverse course since that late December sell-off, but now the key indices appear to be on the verge of breaking out. The Dow Jones Industrial Average (see chart here) also has bounced off its multi-year lows in December and is trading above its key moving averages, the Nasdaq Composite (see chart here) from a technical standpoint is also on the verge of breaking out, however the small-cap Russell 2000 (see chart here) has work to do to reclaim its 200-day moving average.

So what does all this technical jargon mean? It’s no secret the markets trade in algos and bots. Many of these algorithm trading platforms are programmed to certain technical indicators i.e. the 20-day, 50-day, 100-day and 200-day moving averages and/or the relative strength index aka the RSI. Furthermore, in many instances when the key indices are setup at a breakout level such as where the S&P 500 (see chart here) and the Nasdaq Composite (see chart here) find themselves at, momentum traders also come up to the plate and act. So we could very well indeed see the markets make a run to retest the all-time highs. Paula and I wish everyone a safe and Happy St. Patricks Day!

Good luck to all 🙂

~George

S&P 500 - George Mahfouz Jr

Is Gold Breaking Out?

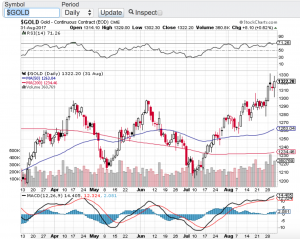
It certainly appears that way. Gold (see chart below) has caught a meaning bid as of late and it’s about time. The yellow medal has been stuck in a trading range between $1200 and $1300 per ounce for months and now has broke through the $1300 level currently trading around $1330 per ounce. What has surprised me is how long it took for gold to finally go from the left side of the chart to the right. Especially considering the geopolitical risk environment we find ourselves in. That said, stocks are saying what risk? As I write this blog, the Dow Jones Industrial Average (chart), the S&P 500 (chart), the Nasdaq (chart) and the small-cap Russell 2000 (chart) once again are all approaching all time highs. This after a very modest pullback in August. So Wall Street continues to remain in the “buy the dip” mood. All year long and every single time stocks experience any type of pullback, buyers come in and lift the markets to all time highs.

How long can this last? From a technical standpoint the key indices remain below the 70 value level of the relative strength index also referred to as the RSI. The RSI is used as a gauge by certain market technicians to see if whether or not stocks in the short term are overbought or oversold. As as these indexes approach all-time highs and should they breakthrough those highs, these markets can and should continue to go higher. However, if they do not breakout here, then one could expect yet another pullback especially as we are now in one of the more underperforming months for equites of the year. Historically September and October for that matter tends to be a difficult time for the markets. However, based on what we have witnessed all year long despite the ongoing geopolitical risks and with interest rates on the rise, the markets may not care about the seasonality trends of September and October. Good luck to all and both Paula and I wish everyone a safe and relaxing Labor Day Weekend 🙂

~George

Gold chart - Paula Mahfouz