A Strong Start!
The stock market had a strong start to the year; however, the back half of the month was more volatile and capped the monthly gains. Out of the major averages, the small-cap Russell 2000 (see chart here) was the clear winner gaining over 5% in January. The Dow Jones Industrial Average (see chart here) advanced 1% while the S&P 500 (see chart here) eked out a 1/2 percent gain, however, the Nasdaq Composite (see chart here) closed the month with a slight loss.
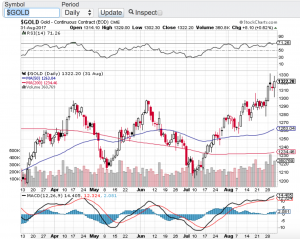
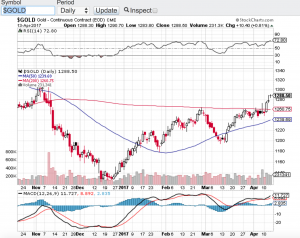
I am not sure what to make of the markets here in 2026. From gold and silver going parabolic then subsequently crashing (click here) to Bitcoin losing over 30% from its all-time high, to the bond market trying to find its footing! It’s no wonder volatility began to spike as January ended. Pundits are pointing to the geo-political risks that are seemingly hitting the headlines daily, to our own country’s divisions that are increasing on the daily, to the Federal Reserve standing pat on interest rates and now ushering in a new Fed Chairman. How in the world can any analyst have the proper visibility as to where the markets are headed this year.
One way to shuffle through all the noise is corporate earnings. We are in Q4 earnings reporting season and so far, we are seeing broad strength in company earnings. Of the S&P 500 companies that have already reported their Q4 results, we are seeing double digit year over year growth which is a metric that investors can rely on. What I am cautious about in the short-term is the unpredictability of foreign and domestic policies. From one day to the next you never know what is going to come out. However, what impresses me is the absolute resiliency of the stock market. Recently have witnessed an invasion, threats of war, increasing domestic infighting, the Federal Reserve forthcoming changing of the guard and yet the markets remain near all-time highs!
Let’s hope soon that the political and economic backdrop comes together sooner rather than later so we can have more clarity as to how the rest of the year for the stock market will turnout.
Good luck to all 🙂
~George