The 200-Day Is In Play…

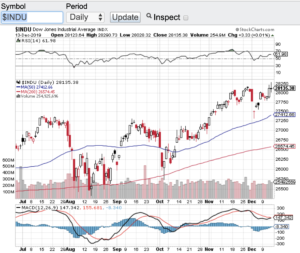
The 200-day moving average is in play! Last week, the Dow Jones Industrial Average (see chart here) breached its 200-day moving average. What does this mean? Well from a technical standpoint the 200-day moving average is one of the more respected support lines when it comes to indexes or stocks. A breach of the 200-day is not what the bulls want to see. The same rings true when stocks or indexes breakthroughs and breaks out above this key technical indicator. When this occurs, it is typically viewed as bullish. Unfortunately, this is not the case today. As mentioned above, the Dow Jones Industrial Average breached its 200-day and closed the week below this support line.

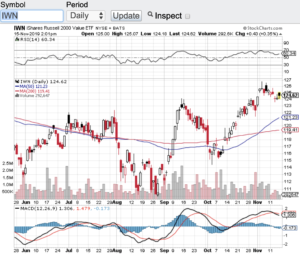
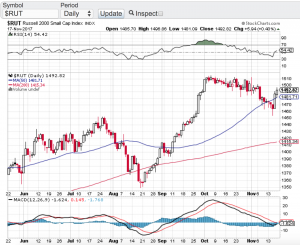
Now before this draws too much attention or significance, these types of technical breaches can be short lived to only recapture this key technical support line and resume its upward trend. We will have to see if this is the case here. Why this technical breach isn’t too alarming yet, is because when I look at the broader markets such as the S&P 500 (see chart here) and the Nasdaq Composite (see chart here) both remain above their respective 200-day moving averages. The same cannot be said for the small-cap Russell 2000 (see chart here). Like the Dow Jones Industrials, the small-cap Russell 2000 also is trading below its 200-day.

So now what? As we head into the month of October, I can say with confidence that the markets will not hang around wondering which direction to take. A breach is a breach, either it follows through and continues its downward trend, or the breach is short lived only to resume its upward trend. One of the upcoming catalysts that will impact the markets is the 3rd quarter earnings reporting season and this my friends will be a determining factor as we head into year-end.

Good luck to all 🙂

~George

It’s A Broken Record!

It’s a broken record indeed! That is the continuing record breaking run on Wall Street. On Friday the Dow Jones Industrial Average (see chart here), the S&P 500 (see chart here), the Nasdaq Composite (see chart here) set new all time highs. Seemingly, there is no stopping this record setting run that the markets have been on, at least for now. The latest catalyst was news out of Washington that the U.S. and China are close to coming to a “Phase 1” agreement on a trade deal. As I eluded to in my November 15th blog, new record highs could come into play by year-end if we see a trade deal happen. The caveat here is the deal is being titled as a “Phase 1” agreement and there is much more to agree upon to finish the deal out. That said, this is a definite step in the right direction and the markets seem to agree. I do want to keep my enthusiasm in check because of the volatility that continues to come out of Washington on this subject. We have all seen over the past several months tweets and statements out of Washington that we are close to a deal with China to only then wake up the next day to get the opposite statement either out of Washington or China. Phase 1 is a great step, but I am looking forward to the complete deal getting done and most likely that will yield to the first quarter of 2020.

In the meantime, investors are continuing to enjoy record highs and there doesn’t seem too much ahead between now and year-end that will change the course. The technical shape of the bellwether indexes remain intact. The Dow Jones Industrial Average (see chart below), the S&P 500 (chart) and the Nasdaq Composite (chart) are all trading below the 70 value level of the relative strength index (RSI). Also, each of these indexes are trading healthily above their 20, 50, 100 and 200 day moving averages.  

Paula and I wish everyone a very safe and happy holiday season.

~George

It's A Broken Record! - Paula Mahfouz


Upward Trend Remains Intact!

Record highs continue as the upward trend in the stock market remains intact! Despite the impeachment proceedings now going public and despite the China trade deal seemingly pausing we are still setting records. The Dow Jones Industrial Average (see chart here), the S&P 500 (see chart here) and the Nasdaq Composite (see chart here) all hit record highs this week. The small-cap Russell 2000 (see chart below) is holding its own in the overall upward trend, however, this index remains below its all-time high by 150 points or so.

The good news today coming out of the White House is that we are getting closer to a deal with China. This news was enough to send the Dow Jones Industrial Average (chart), the S&P 500 (chart) and the Nasdaq Composite (chart) to all time highs yet again. It is incredible that just a blurb out of the White House regarding a potential deal sends stocks rip roaring ahead. One of the concerns I have about actually seeing a deal get done by year-end is that next week it is possible a tweet from our President may read the exact opposite. If you look back and think about it how many times have we seen a tweet or an announcement that a deal is getting closer only to have the next statement speak to the exact  opposite. Hopefully today’s announcement (click here) sticks and that we actually see a trade deal get done by year-end. No more talk!

If indeed a trade deal gets done there no question this will be good for business here in the U.S. Although it may feel that stocks and the key indexes are overbought, if a deal gets done then it is very possible that we continue to notch records between now and year-end.

Good luck to all 🙂

~George

The Uptrend Remains Intact - George Mahfouz

Tis The Season…

As the holiday season fast approaches stocks have a lot to be jolly for. Despite the recent pop in volatility, the major averages continue to enjoy their record setting ways. The Dow Jones Industrial Average (chart) closed the week at 23,258, the S&P 500 (chart) finished the week at 2,579, the tech focused Nasdaq composite (chart) closed at 6,783 and the small-cap Russell 2000 (see chart below) ended the week at 1,493 while recapturing its 50-day moving average.

Next week is a shortened trading week due to Thanksgiving. Historically the Thanksgiving holiday week tends to be a bullish week for equities with 75 percent of the time the markets finish higher. Add the seasonality factor into the mix and things look pretty good between now and year end. This doesn’t mean that things won’t be choppy along the way especially as the yield curve has many investors paying closer attention to it. Interest rate chatter is seemingly picking up lately despite the Federal Reserve being candid about their position and intentions. This will become further apparent when Fed chair Yellen speaks next week along with the release of the minutes from the last Federal Reserve meeting. All in all it appears that the status quo should be in place between now and year and if this is the case, new market highs should be set.

Earlier I spoke to how the small-cap Russell 2000 ( see chart below) has recaptured its 50-day moving average. This is important from the standpoint that investors and traders alike look to the Russell as a key indicator to the overall health of the broader markets. Recently the Russell has been showing some cracks in its trading patterns including noticeably breaking its 50-day only to recapture it and hold above it a few days later. If you are long this market, this is a bullish sign. That said, I do expect volatility to be present between now and year with the potential of making new highs along the way.

Paula and I wish everyone a very safe and Happy Thanksgiving 🙂

~George

Russell 2000 Paula Mahfouz

Quietly The VIX Elevates…

Over the past week the CBOE Market Volatility Index aka the VIX (see chart below) has risen over 35%. Not too surprising considering the upcoming elections and the daily rhetoric that has been hitting the wires. What is surprising to me is that even though volatility has spiked recently, the markets have not really dropped. Isn’t how this is supposed to work? Increase in vol equals lower stock prices? The Dow Jones Industrial Average (chart), the S&P 500 (chart) and the Nasdaq (chart) all remain within striking distance of all-time highs and so far these key indices do not seem to be too bothered by the daily political headlines. Even Friday’s surprising if not shocking news that F.B.I. director James Comey has re-opened the Hillary Clinton email case could not rattle the markets. Although this particular headline did send stocks sharply lower in the late afternoon trading on Friday only to find support and close off of the lows.

I will say this; I am even more surprised that yesterday we did not see a sell-off in stocks after everyone had time to digest the news over the weekend. Stock market pundits continue to claim that the markets have priced in a Clinton victory and that her taking the White House in general will be bullish for stocks. I tend to agree with this however; my concern is will this be a “sell the news” event? I will also be paying closer attention to the polls this week to see if the Trump campaign closes in on the Clinton lead. This too can be a market moving dynamic. So as the VIX continues to lift and as we get closer to November 8th, I will error on the side of caution and lighten up any long positions and wait to see how this election plays out. Let’s also see how the markets react and respond to the election results and then come up with a game plan into year-end. Good luck to all 🙂

~George

VIX chart George Mahfouz Jr