Yet Another Record Month!
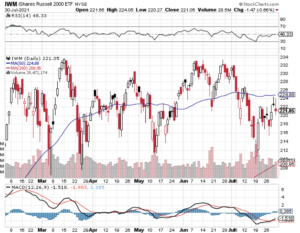
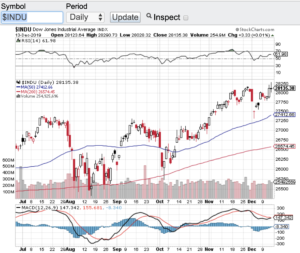
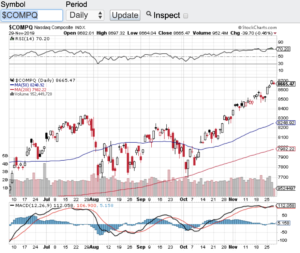
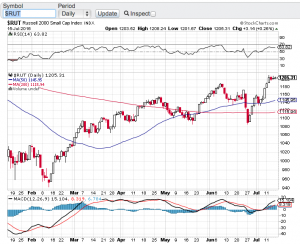
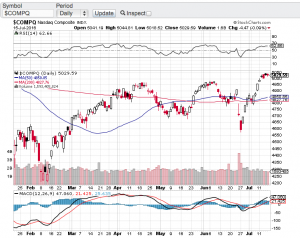
It’s hard for me to believe that I am writing again about another record month in the stock market! This time it not just the Nasdaq Composite (see chart here) and the S&P 500 (see chart here). Last week the Dow Jones Industrial Average (see chart here) and the small-cap Russell 2000 (see chart here) also set all-time highs! What in the world is going on? Especially with the world we are currently living in. The most sophisticated minds on Wall Street are also having a hard time understanding the markets today.
Let’s start with the war, oil prices and inflation. This is a triple whammy to the economy and to future economic growth. So how is it all four major averages set records this week? Sure, the A.I. trade continues to attract investment from around the globe and one can argue that this ilk that continues to lead the charge. In fact, it’s a fact! This is where I have concern. There is such a large concentration of A.I. stocks or A.I. related stocks that are responsible for these ongoing record highs. If it wasn’t for the substantial gains in A.I. stocks both the S&P 500 and the Nasdaq Composite would barely be up on the year. I don’t know about you, but this does not feel right to me. My preference would be a broad-based rallying generating record highs versus once particular sector.
As the war in Iran continues and as inflation is nearing 4%, I think it is safe to say we are due for a pullback in stocks. Both the Nasdaq Composite (see chart here) and the S&P 500 (see chart here) have entered into overbought territory according to the Relative Strength Index (RSI) principles. If you are long the market, consult with your financial advisor to see if you should be making any adjustments to your portfolio. If you are considering entering the market, again consult with your financial advisor before you enter or add on to any new positions.
Good luck to all 🙂
~George