Stimulus Package Chatter Buoys Markets…

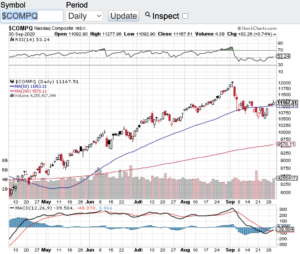
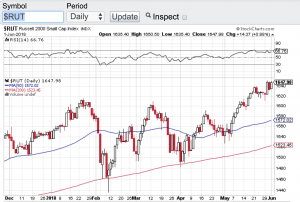
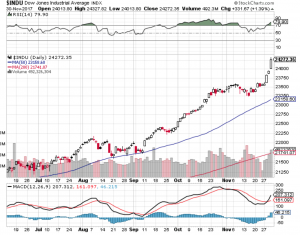
Yesterday, the lastest round of stimulus package chatter came out of Washington which helped buoy our markets. The Dow Jones Industrial Average (see chart here) closed the month of September out at 27781, the S&P 500 (see chart here) finished the month at 3363, the Nasdaq Composite (see chart below) closed at 11167 and the small-cap Russell 2000 (see chart here) finished at 1507. Although stocks had a strong close to end September, the month of September was a net negative for the markets. No question the uptick in COVID both here and abroad has put some pause to this bull market rally. Quite honestly, I think stocks have held up pretty well despite the ongoing pandemic and the constant tape bombs coming out of Washington.

Fast forward to today and we are now a month away from our Presidential election. I have got to believe that we are heading into more volatility than what we experienced in September. I think whoever watched the first Presidential debate would agree. In addition to the upcoming election, we are also heading right into Q3 earnings reporting season. Corporate America will be releasing their third quarter financial results over the next 45 days or so and that alone can create higher volatility. I am not sure what to expect when companies report their numbers and even more so how companies provide their forward looking guidance on their conference calls. Whatever the case is, I think it’s fair to say we will not be trading sideways here in the month of October.

Let’s take a gander at the technical shape of the aforementioned indexes. What has impressed me lately is how the Dow Jones Industrial Average (see chart here) found support near its 200-day moving average and more recently its 50-day moving average. The same can be said for the other major averages in how they too have found support at their respective moving averages. What’s more is these key indices are no where near overbought territory according to the relative strength index aka the RSI. So from a technical analysis standpoint, the markets look to be on solid footing.

Good luck to all 🙂

~George

Stimulus Package Chatter Buoy Markets - Paula Mahfouz

Trade War Back On!

Here we go again, the trade war is back on! Donald Trump yesterday once again fired up the trade war this time including the EU, Mexico and Canada. How is an investor supposed to confidently invest when the message and policies of our government change almost daily. Stocks all week have been whipsawed around which is great for the trader, but no so much for the investor. Now we have countries from around the world retaliating with their own tariffs on our goods. The Dow Jones Industrial Average (chart) finished the week at 24635, the S&P 500 (chart) closed the week out at 2734, the Nasdaq Composite (chart) closed at 7554 and the small-cap Russell 2000 (see chart below) showing its incredible resilience finishing the week out near an all-time high.

The chop action that we are seeing in the markets along with the unpredictably of our government gives me more reason now to focus in on the technical trading patterns of stocks and indices. Whether it is support or resistance levels vis à vis moving averages (click here) i.e. the 20-day, 50-day, 100-day, 200-day or outright overbought or oversold conditions using the Relative Strength Index (click here) or the Bollinger Bands (click here) which can also provide a technical look into extreme conditions. With Q1 earnings reporting season essentially wrapped up, there is no real apparent catalyst to move the markets in a meaningful way. Which is why I will be paying much closer attention to the technical make up of the markets to identify opportunities.

One of my favorites are the moving averages (click here) especially the 200-day moving average. For example, just take a look at the Dow Jones Industrial Average (chart) and the S&P 500 (chart). You’ll see over the past few months each time these indexes gravitated to their respective 200-day MA, they found support and proceeded higher. There is no guarantee that moving averages will always hold and provide support, but in many instances it indeed acts as a short term floor to selling pressure. There are many resources on how technical analysis can work and I would recommend studying the dynamics of TA before including it in your investment or trading strategies. Good luck to all 🙂

~George

Russell 2000 - Paula Mahfouz


Dow 24,000 – Bitcoin $10,000 – Why Not?

Is this really happening? Stocks exploded to the upside on the last trading day of November. For the first time in its history, the Dow Jones Industrial Average (see chart below) traded, blew through and closed above the 24,000 mark. The Dow started the year just under 20,000 and no one and I mean no one in the who’s who of finance, analysis, technical analysis, hedge funds, institutional investors and the like, ever predicted this type of performance for stocks and the key indices on the year. I cannot even count the number of record highs that have occurred this year not only in the Dow Jones Industrials, but also the S&P 500 (chart), the Nasdaq composite (chart), and the small-cap Russell 2000 (chart). Let’s throw in Bitcoin and its year to date 10X performance and we are truly in party mode.

I am not even sure what to think? This eerily feels like the irrational exuberance environment that occurred in the mid to late 90’s and before the internet bubble imploded. However the bullish pundits are quick to point out that this time is different. Back then, whoever came out with an announcement that they just launched a website saw their stock go up. Now the pundits are pointing out that it is earnings and growth that are responsible for this torrid record setting pace we have been on all year long. This is true to some degree. But what about the euphoria in Bitcoin? What is the catalyst that has propelled this so call asset to fly up over 10 times this year? This is why the other side of the camp thinks we are approaching a bubble or at the very least nose bleed territory. Without question I feel that something is going on that makes one have to pause and take a breather here. But as we have seen all year long, don’t underestimate the power of momentum, a low interest rate environment and the Trump trade. Is it possible that the Dow Jones Industrials actually could close above 25,000 by year end? As much as I want to say and think “no way”, way! Not saying the Dow will go up another 800 points by year end, but if we do, I would not be at the very least surprised.

Good luck to all 🙂

~George

Dow Jones Industrial Average - George Mahfouz Jr

No Bubble Here…

At least according to Janet Yellen as she spoke before the Senate Banking Committee on Thursday. In a prepared speech to the committee, Vice Chair Yellen stated that the U.S. economy continues to improve and that the housing market has turned a corner with construction, home prices and sales up significantly. Ms. Yellen went on to indicate that she supports the Federal Reserve’s monetary policies which continue to purchase bonds and mortgage backed securities. Investors took this cue as a very positive sign going forward and sent the markets yet again to all time highs this past week.

For the week, the Dow Jones Industrial Average (chart) closed up 1.3% and is also closing in on the 16,000 mark, the S&P 500 (chart) gained 1.6%, the Nasdaq (chart) +1.5% and the small-cap Russell 2000 (chart) finished the week up 1.47%. Stocks continue to be on a tear and now it is clear that unless their is some unforeseen negative macro-event that occurs from now until year end, these markets should close the year out with over 20% gains respectively. Now that doesn’t mean that pullbacks or even a modest correction couldn’t occur, but should this be the case, I would assume that any retracement would be met with the “buying the dip” mentally that has gone on all year long.

Now let’s take a look at how the technical conditions are shaping up for the aformentioned key indices. When I consider running a technical analysis on stocks or indexes, the two indicators I favor the most are the Relative Strength Index also know as the RSI and the moving averages. Out of plethora of technical indicators out there, these particular indicators are the most reliable, at least for me. Part of the reason why I favor the RSI and moving averages indicators are that many computerized trading models and certain institutional investors utilize them, which in turn moves the market. Historically, when the Relative Strength Index (RSI) is at an overbought or oversold condition, the majority of the time the asset or index reverts back to the mean. Same rings true with the moving averages, whenever a stock or index rises up against or comes down to its moving average, typically the stock or index finds support or resistance. So in looking at the current state of the Dow (chart), S&P 500 (chart) , Nasdaq (chart) and the Russell 2000 (chart) all of these indexes are indeed approaching overbought territory which according to the RSI definition is the 70 value level, but they are not there yet. Actually, my personal preference is to not only see a breach of the 70 value level but a continuation up into overbought territory before I consider selling into that condition. As it pertains to the moving averages technical indicator, these key indices are all comfortably above their respective 20-day and 50-day averages, with the 200-day moving average no where in sight.

So what does all of this mean? Technically speaking and considering we are heading into year end, there is a high likelihood that markets continue to head north, but I will be paying close attention to the technicals as to when we may see the inevitable pullback.

Good luck to all and have a great weekend 🙂

~George

Impressive resilience…

Despite the incessant flow of “fiscal cliff” news from all of the media outlets, stocks continue to hold their own. For the week, the Dow Jones Industrial Average (chart) closed up 1%, the S&P 500 (chart) + 0.13%, the Nasdaq (chart) -1.07% and the small-cap Russell 2000 (chart) finished the week flat. Not too shabby considering all of the fear and uncertainty surrounding the fiscal cliff and that Washington has not really progressed towards a deal.

With only a few weeks left in trading year and the fiscal cliff deadline, what is an investor or trader to do? Well if you are a trader you should love this type of environment. I am expecting volatility to pick up steam between now an year end. This should present larger market swings and provide excellent trading opportunities both on the long and short side. If you are an investor you may want to sit it out until we get a deal out of Washington. I remember the days when you would make investment or trading decisions based on fundamentals and technical analysis. Now seemingly the biggest factors are whether or not the central banks will continue to support the markets and whether or not Washington can get along. Needless to say, this dynamic has placed additional uncertainty on the markets and investors or traders now have to add this in the mix of their decision making processes. Good luck to all.

Have a great weekend 🙂

~George

A bull breather…

After such a torrid bull run this summer and with most major averages posting double digit gains, stocks finished lower this week, albeit modestly. For the week the Dow Jones Industrial Average (chart) closed down 0.10%, the Nasdaq (chart) -0.13%, the S&P 500 (chart) -0.13% and the Russell 2000 (chart) finished the week off 1.06%. This minor pullback is nothing compared to the rare and impressive September monthly gains with all of the above key indices advancing well over 3% so far this month.

As equities continue to remain strong after the Fed announced their latest stimulus package last week, I continue to monitor the underlying technicals of the markets and from what I see, the coast continues to remain clear. The one exception to how the big four is looking technically is that these key averages are at or near the 70 value level on the Relative Strength Index (RSI).  The RSI is a technical analysis indicator which measures gain and losses over a given period of time to identify whether or not stocks or indexes are currently oversold or in this case overbought.

That said, with central banks from around the world ready to flood the markets and economies with liquitidy if needed, I am now of the belief that stocks and certain commodities should remain overbought for the foreseeable future with the occasional pullbacks along the way. Good luck to all.

Have a great weekend 🙂

~George Â