Broken Records, Literally…
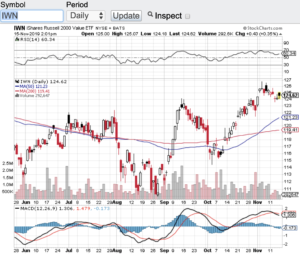
Records continue to be broken as both the Dow Jones Industrial Average (see chart here) and the S&P 500 (see chart here) set records highs yet again last week. Yes, what typically is a softer month for stocks these major averages ignored history and recorded all-time highs. The Nasdaq Composite (see chart here) and the small-cap Russell 2000 (see chart here) lagged a bit, but still is within striking distance of their all-time highs.
With all the uncertainty out of Washington, whether it’s the ongoing tariffs saga or the continuing demands directed at the Federal Reserve, how is it possible that index records are continuing to be set? One factor is the Federal Reserve is changing its tone on interest rates. The pressure has been on the Fed to start reducing rates since the beginning of the year. The Federal Reserve has a dual mandate pertaining to interest rate policies and that mandate is jobs and inflation. Unfortunately for the Fed, they are in a pickle. On one hand the job market has deteriorated over the past months, however, inflation continues to tick up. This is why the Fed has had their hands tied so far this year. But with the latest dismal job report that was issued in August, this has tilted the Fed to change their guidance to a more dovish tone. The markets have certainly has responded as evidenced by the new records that the Dow Jones Industrial Average (see chart here) and the S&P 500 (see chart here) have set.
Speaking of the jobs report, the August jobs report is schedule to be release on Friday September 5th. All eyes will be on this report which should cement rate cuts. If we see an even weaker than expected number, this could case the upcoming rate cut to be even more aggressive than the street is expecting. Whatever the case may be, I expect a volatile week ahead for the markets with plenty of opportunities.
Good luck to all 🙂
~George