Tis The Season…

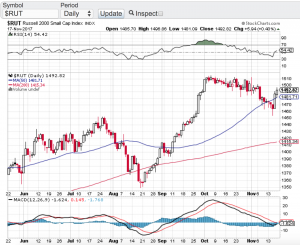
As the holiday season fast approaches stocks have a lot to be jolly for. Despite the recent pop in volatility, the major averages continue to enjoy their record setting ways. The Dow Jones Industrial Average (chart) closed the week at 23,258, the S&P 500 (chart) finished the week at 2,579, the tech focused Nasdaq composite (chart) closed at 6,783 and the small-cap Russell 2000 (see chart below) ended the week at 1,493 while recapturing its 50-day moving average.

Next week is a shortened trading week due to Thanksgiving. Historically the Thanksgiving holiday week tends to be a bullish week for equities with 75 percent of the time the markets finish higher. Add the seasonality factor into the mix and things look pretty good between now and year end. This doesn’t mean that things won’t be choppy along the way especially as the yield curve has many investors paying closer attention to it. Interest rate chatter is seemingly picking up lately despite the Federal Reserve being candid about their position and intentions. This will become further apparent when Fed chair Yellen speaks next week along with the release of the minutes from the last Federal Reserve meeting. All in all it appears that the status quo should be in place between now and year and if this is the case, new market highs should be set.

Earlier I spoke to how the small-cap Russell 2000 ( see chart below) has recaptured its 50-day moving average. This is important from the standpoint that investors and traders alike look to the Russell as a key indicator to the overall health of the broader markets. Recently the Russell has been showing some cracks in its trading patterns including noticeably breaking its 50-day only to recapture it and hold above it a few days later. If you are long this market, this is a bullish sign. That said, I do expect volatility to be present between now and year with the potential of making new highs along the way.

Paula and I wish everyone a very safe and Happy Thanksgiving 🙂

~George
Russell 2000 Paula Mahfouz

Are Energy Stocks And Banks Cracking?

As technology stocks continue to tick up to new record highs, banks and even more so energy stocks are showing signs of weakness. Yesterday, the Nasdaq (chart) hit an all time high of 6221.99 and the S&P 500 (chart) also notched a record recently at 2418.71. That said, the energy sector has lost almost 10 percent in the last month or so and the banking sector is beginning to technically breakdown. A very noticeable divergence is happening here and I think it is time to pay attention to this recent dynamic. The Dow Jones Industrial Average (chart) remains above 21000 and the small-cap Russell 2000 (chart) is seeking direction.

I am not surprised that certain sectors of the market are showing weakness which is only normal with the tremendous run the markets have had since the election, however, it is the sectors that are breaking down that is a bit alarming to me. One has to ask is the price action in oil and energy stocks indicative of weakening demand hence a weakening economy? Or is this just a matter of too much supply in oil regardless of the O.P.E.C. commitment to its production cuts. As far as the banks are concerned, one would also think with the Federal Reserve raising interest rates at their upcoming meeting in June and committing to additional rate hikes this year. that this would be bullish for bank stocks. Not the case recently. I am a little perplexed to the way the tape has been acting as of late especially pertaining to the aforementioned sectors.

The technical shape of the key indices appear to be intact with the exception of the small-cap Russell 2000. The Dow Jones Industrial Average (chart) is trading well above its 50-day moving average, along with the S&P 500 (chart)  trading near all-time highs and the Nasdaq (chart) as mentioned above hit an all-time high yesterday. However, the small-cap Russell 2000 (chart) is trading below its 50-day moving average and has been challenging certain support zones lately. This is yet another potential alarm along with the energy and banking sector weakness lately. So I would not be surprised to see the selling pressure in these particular sectors continue in the month of June which is historically one of the weakest month of the year for stocks. Good luck to all 🙂

~George

The Trump Rally Continues…

Caught off guard! I think this phrase wraps it up. After Donald Trump won the presidential election both voters and markets were caught off guard. The polls all but had Hillary as a shoe in for the oval office. Instead the exact opposite occurred not only with the election but how wrong the markets had it if Donald Trump pulled it off. Not only did the markets not crater, (although last Tuesday evening when the voting results were coming in the futures were tanking) stocks are back to setting records. Since the election, the Dow Jones Industrial Average (chart) hit an all-time high of 18,934, the S&P 500 (chart) is within striking distance of its all-time high, the small-cap Russell 2000 (chart) also hit an all-time high, however, the tech focused Nasdaq (chart) is lagging a bit due to the uncertainty of the new Trump administration policies on trade and how this could affect the technology space.

It has been quite a while since the markets have responded in such a bullish manner. Today marks the 7 straight day of gains for the Dow Jones Industrial Average (chart) led by industrials and banks. The banking index has exploded due to the hope that the Trump administration will relax or reverse the Dodd-Frank act which places overbearing regulations on the financial industry as a whole. Check out one of the most widely held bank exchange traded funds Symbol: XLF (chart). This ETF has moved up over 10% in the past week alone, simply unheard of. Other benefactors to the Trump presidency is anything and everything in infrastructure and materials. Trump pledges to spend over $1 trillion dollars rebuilding America’s infrastructure to include highways, roads, bridges, airports etc. It’s no wonder the markets are setting records once again.

Now what? Without question Trump winning the election is seemingly good the for the economy and so far for the stock market. However, as with any rally or sell-off for that matter, “reversion to the mean” typically occurs. I would be very careful chasing this rally or deploying any new capital. My preference is to wait until the inevitable pullbacks occur and look at the aforementioned sectors to consider any new positions. Of course it is always prudent to consult with a certified financial planner(s) before making any investment decisions. Good luck to all 🙂

~George

Is It A Looming Rate Hike, Or Something Else?

After posting blistering gains in the month of October, stocks took it on the chin last week and it’s technically looking like more short-term downside could be in the cards. For the week, the Dow Jones Industrial Average (chart) lost 665 points, the Nasdaq (chart) retraced 219 points or 4.3%, the S&P 500 (chart) -76 points and the small-cap Russell 2000 (chart) closed lower on the week by 53 points or 4.4%.

Seemingly, the start of the selling pressure accelerated when the October labor report came out surprisingly strong. This report was released on November 6th. One could say that this is the main reason stocks have been under pressure. Pundits are now calling with almost certainty that the Federal Reserve has the green light to raise interest rates at their next meeting in December. Couple this will commodity prices continuing to fall, in particular oil, which is down recently almost 10% and you can understand why the markets would be under pressure. Or could it be the simple fact that October saw almost 10% gains across the board and the key indices were overdue for a pullback. I’d like to add to the mix that the latest round of economic numbers could also be weighing in on investor sentiment. This is evidenced by a weaker than expected retail sales number and weak retail earnings reports issued last week along with a very weak Producer Price Index. Sum all of this up and it’s no wonder the aforementioned indexes closed lower by almost five percent last week. From a technical perspective the key indexes have now breached their respective 200-day moving averages and if you are bullish, you would want to see the markets recapture this key technical support line and return to the uptrend that was intact throughout the month of October.

As the Thanksgiving Day holiday fast approaches, both Paula and I wish everyone a very safe, healthy and Happy Thanksgiving 🙂

~George

Are You Kidding Apple?

A $74.6 billion dollar quarter! Simply breathtaking! Apple also generated a record net profit of $18 billion, the highest quarterly net profit ever, for any company. Earnings reporting season is in high gear and no one so far have remotely come close to such an impressive performance. Congratulations Apple! That said, the overall market in the month of January did not fare as well. For the month, the Dow Jones Industrial Average (chart) lost 3.7%, the Nasdaq (chart) pulled back 2.1%, the S&P 500 (chart) retraced 3.1% and the small-cap Russell 2000 (chart) closed the month of January off 3.3%. Note that the majority of the monthly losses occurred in the past trading week. January also experienced a spike in volatility with the CBOE Market Volatility Index also known as the VIX (chart) closing just a tad under 21. The VIX is referred to as the “fear gauge” which shows the market’s expectation of upcoming volatility by calculating implied volatilities of both calls and puts of S&P 500 index options.

Technically speaking, the above key indices are fast approaching their respective 200-day moving averages, especially the Dow Jones Industrials (chart). Remember, the moving averages is amongst the most favorite technical indicator utilized by market technicians, computerized trading models and institutional investors alike. Furthermore, the relative strength index  of the aforementioned key indices are not in oversold conditions. The RSI is another favorite technical indicator of certain market technicians . So should the markets continue to experience an increase in volatility, the 200-day moving average should provide meaningful support as long as earnings reporting season closes out on a high note. I will monitor the technicals of the markets closely and wait to see how the balance of Q4 earnings reporting season plays out. If we test the 200-day moving averages and hold that level, and if earnings continue to come in positively, I would be then be inclined to become more bullish on equities. However, if we breakdown technically and if corporate America begins to show signs of slower growth, we will then be having a different discussion. Good luck to all!

Paula and I wish everyone a Happy Super Bowl Sunday 🙂

~George

Overbought Conditions and Iraq Weigh In On Stocks…

After the Dow Jones Industrial Average (chart) and the S&P 500 (chart) set all time highs last Monday, the conflict in Iraq and overbought conditions spun a modest pullback in the key indices. Although some are attributing the selling pressure to the unexpected defeat of the House majority leader Eric Cantor (R., VA).  For the week, the Dow Jones Industrial Average (chart) lost 148.54 points, the tech ladened Nasdaq (chart) -10.75 points, the S&P 500 (chart) -13.28 points and the small-cap Russell 2000 (chart) closed slightly lower on the week. What has been eye popping to me is how complacent and tranquill market participants have been. Over the past several months and especially the past couple weeks, investor sentiment has been extremely bullish which in turn has sent the VIX to multi-year lows. The VIX, also know as the fear gaugeis used as an indicator of investor sentiment. Recently the value of the VIX (chart) hit a trough low of 10.73, its lowest level since 2006. Out of all of the market events that are going on, this indicator has me concerned more than any other. As much as I have been bullish on the overall markets, when sentiment gets this comfortable and the VIX trades this low, historically markets set up for a pullback or even a correction of sorts.

This set-up is just what both the bears and the bulls have been waiting on. I personally have been tempted to short this market considering the historic record breaking run up stocks have had. But I have learned a long time ago is you don’t want to step in front of the Federal Reserve or a freight train either, which is what this market has been. So my preference is to be patient, wait for whatever pullback(s) or correction we may get, and then begin to scale in on certain long positions. I will refer to the technical set-ups of indexes and certain equities to assist me in establishing entry points. Click here to see what I look at pertaining to technical analysis. Now whether you are a technical trader or fundamental investor, the fact remains that markets remain awash with liquidity thanks to the Fed, and there really is no where else to get the alpha that hedge funds and institutional investor alike need for their performance mandates. So knowing that these institutions really dictate the ebbs and flows of the markets, my bets will continue to align with theirs and over the past few years whenever we do experience an increase in market volatility and market pullbacks, a buy signal usually ensues. Please remember it is always wise to at least consult with a certified and trusted financial advisor(s) before you compose any investment strategy or make any investment decisions. Good luck to all.

Happy Father’s Day 🙂

~George