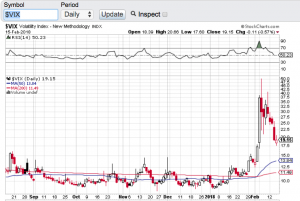
Volatility Hits The Markets…

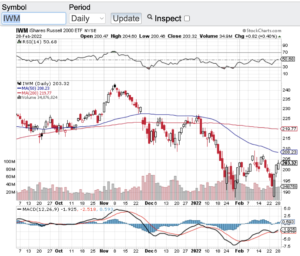
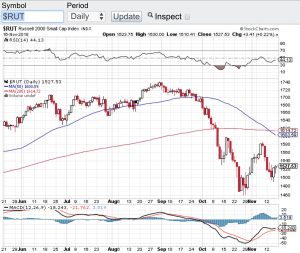
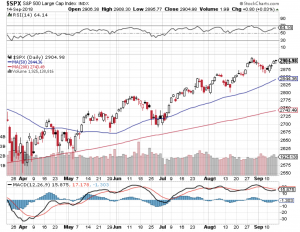
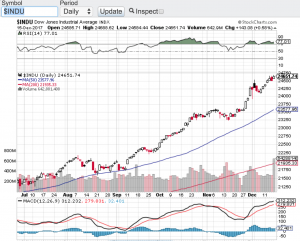
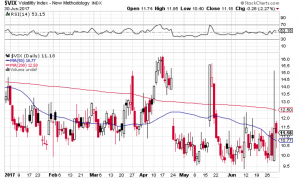
Volatility has hit the markets to the point that the VIX (see chart here) aka the fear gage has broken out. Stocks have been on a tear as of late but unfortunately to the downside. No one is surprised that the markets have become extremely volatile due to the Russian invasion of Ukraine. The Dow Jones Industrial Average (see chart here) fell over 10% since the crisis began as has the S&P 500 (see chart here). Both the Nasdaq Composite (see chart here) and the small-cap Russell 2000 (see chart here and below) have sold off closer to 15% before bouncing off of their sell-off lows. Again, no surprise that vol has spiked to almost a double over the past few weeks as tensions increased.

Before we get into the technical shape of the markets it’s hard for me to even talk stocks and indexes due to the atrocities happening abroad. Our prayers go out to everyone in the Ukraine that is being affected by this invasion and for the people of Russia who wants no part of this. Hopefully very soon a cease fire will happen and happen for good!

Now let’s look at the technical set-up that has occurred since the buildup and invasion with the aforementioned key indexes. Starting with the Dow Jones Industrial Average (see chart here). The Dow a few days ago hit a low of 32272 and has bounced to the 34,000 zone. There is much more work here to be done before the Dow can recapture its 100 and 200-day moving averages. The same can be said for the S&P 500 (see chart here) although with the S&P, it is closer to its 20-day M/A than the Dow Jones Industrials Average. Interestingly both the Nasdaq Composite (see chart here) and the small-cap Russell 2000 (see chart here) have bounced off of their recent lows stronger with the Russell 2000 recapturing its 20-day M/A. Despite the recent bounces off of their sell-off lows I think it is fair to say that we are not out of the woods yet in the volatility we have seen as of late. If you are a long-term investor, this will pass at some point in time. For experienced traders this is an environment where money can be made both on the long and short side of the markets. That said, I always recommend consulting your certified professional financial advisor(s) before making any moves in the backdrop we currently find ourselves.

Good luck to all 🙂

~George

Volatility Hits The Markets - Paula Mahfouz

Fear Of A Global Pandemic Grips Markets!

Stocks went into a tailspin as fear of a global pandemic grips the markets! New outbreak clusters of the highly contagious coronavirus are beginning to surface which is pressuring leaders from around the world to act and act more aggressively. Stocks have also entered correction territory as companies and analysts begin to ratchet down their revenue and earning forecasts. Over the past week or so the Dow Jones Industrial Average (see chart here) has lost over 10% in the past week alone, the S&P 500 (see chart here) has also entered into correction mode, the Nasdaq Composite (see chart here) has been hit hard and the small-cap Russell 2000 (see chart here) is also witnessing a sharp sell-off.

Personally I believe a correction was needed because of how robotic the markets have acted. Stocks no matter what risks were out there behaved in a way never before seen. We have been in the strongest bull market ever and nothing over the past 12 years could slow this bull market down. Now I am not happy that it is a global health risk that’s the catalyst to put stocks in correction mode, but nonetheless this is where we find ourselves. Of course when fear is rampant in any market this is where opportunity can be found. I am not suggesting to jump in here because as we all know fear and/or greed can be excessive and markets tend to over do it when emotions take the lead over rational thinking. So when we get overextended to the upside or downside the first thing I look at is how the technicals look during extreme market moves.

When I now look at the technical shape of the markets at least at it pertains to the moving averages things do not look so good. The Dow Jones Industrial Average (see chart here), the S&P 500 (see chart here) and the Russell 2000 (see chart here) have all breached their 20-day, 100-day and 200-day moving averages which are all seen as major support zones especially the 200-day. The Nasdaq Composite (see chart here) is the only major index that has yet to close below its 200-day. That said, all of the aforementioned indexes are oversold according to the relative strength index (RSI) which when we see the 20 value level hit on any stock or index, snap back rallies can and do occur. This type of market is great for traders if you are experienced enough to trade off of technicals, however for investors that have a long term view these type of market environments requires a lot of patience and keeping the emotions at bay. Let’s all hope that the spread of the coronavirus abates and that a vaccine becomes available as quickly as possible.

Good luck to all 🙂

~ George

Tariffs and Interest Rates…

Tariffs and interest rates are at front and center. Now that Q3 earnings reporting season is winding down, without question the two remaining catalysts for these markets between now and year-end are  tariffs and interest rates. It’s been a long time since we have seen the swings that are going on right now in the stock market. Investor’s and trader’s alike are attached to every headline or tweet pertaining to the current trade war between China and the U.S. and whether or not the Federal Reserve will take its foot off of the pedal. The growing tensions between China and the U.S. regarding tariffs did abate late Friday when President Trump tweeted that China does want to make a deal. This was enough to rally the markets on Friday afternoon, but not enough to get the the key indexes out of the red on the week. On the week, the Dow Jones Industrial Average (chart) closed at 25,413, the S&P 500 (chart) closed at 2,736, the Nasdaq Composite (chart) closed at 7,248 and the small-cap Russell 2000 (see chart below) finished the week out at 1,527.

With the aforementioned looming catalysts on the horizon the big question is will we get a year end rally? My feelings are we may only need one of these catalysts to come through for a potential year-end rally. If China and the U.S. can agree upon more favorable terms to the imposed existing tariffs and/or actually withdraw some of the existing tariffs, we may have a shot. Not to say interest rates aren’t important, but relatively speaking interest rates still remain historically low. Even if the Federal Reserve raises rates in December, I still think that a China U.S. deal would be enough for a rally as we close out 2018. The G20 summit is just two weeks away and let’s hope some sort of deal can come forward out of the summit. Good luck to all 🙂

~George

Russell 2000 - Paula Mahfouz


Finally A Market Selloff!

In my last blog, I eluded to a market selloff that just did not happen and I was referring to how stocks typically behave in the August and September. Instead of markets selling off at the end of summer, stocks were setting records. Well the bears got what they had been anticipating over the summer and that is an eye-popping market drop last week. Over the course of two days the Dow Jones Industrial Average (chart) fell over 1300 points. Of course the S&P 500 (chart), the Nasdaq Composite (chart) and the small-cap Russell 2000 (chart) all fell in harmony as well. What’s more these bellwether indexes all breached their 200-day moving averages for the first time in months with the Dow Jones Industrial Average (chart) recapturing and closing above its 200-day on Friday, the Nasdaq Composite (chart) just closed shy of its 200-day, the S&P 500 (chart) literally closed right at its 200-day however, the small-cap Russell 2000 (chart) closed out last week meaningfully below its 200-day moving average looking to find some sort of support. The 200-day moving average is widely regarding by market technicians and institutional investors as a key metric of support and or resistance.

What does all this mean? First, a market that constantly goes up with no retracement to speak of can never be healthy long term. There must be backing and filling along the way so that the risk of a sudden and potentially drastic drop doesn’t occur as what we witnessed last week. I mean c’mon going up in the way that we have over the past decade is not only unheard of but the risk that can come forward from this can spark a nasty correction. I am not suggesting that this will be the case but for the first time since earlier in the year, investors and traders felt the selloff last week.

Earnings reporting season kicks in this week with hundreds of companies set to report. Let’s see if corporate earnings can buoy the market here during this long anticipated selloff. Good luck to all 🙂

George

Traders And Investors Are Awaiting A September Selloff…

Traders and investors are awaiting a September selloff that actually may not come. Stocks continue to demonstrate strength and resiliency despite the political turmoil in Washington DC, rising interest rates and a seasonality headwind that just isn’t happening. August and September are typically weaker months for the stock market, instead the S&P 500 (see chart below), the Nasdaq Composite (chart) and the small-cap Russell 2000 (chart) hit all-time record highs and the end of August and despite a mini pullback shortly thereafter, the markets appear to have stabilized near all time highs. The Dow Jones Industrial Average (chart) did not make an all-time high in August, however, this index remains within striking distance of its all time high. The pundits are speaking to the strength of corporate America where earnings and profits are at their highest levels in decades as to the reason why the markets are not selling off. What is undeniable is that any time stocks have experienced a pull back it has been met with support from institutional investors and retail investors alike.

Speaking of support, let’s take a closer look at the technical shape of the aforementioned key indexes. Let’s start with the S&P 500 (chart). After pulling back to its 20-day moving average the S&P is right back at a breakout point. Next week we should see if the S&P can indeed breakout or fail and head back to its 20-day. The Nasdaq Composite index (chart) has similar chart pattern although it traded a bit below its 20-day support line for a few days before recapturing its 20-day and is now trading above it. A look at the Russell 2000 (chart), it too closed above its 20-day moving average and last but not least the Dow Jones Industrial Average (chart) also closed above its 20-day and this index is also right at a breakout or breakdown point. These bellwether indexes are also not in an extreme overbought condition according to the Relative Strength Index. The RSI tracks overbought or oversold conditions and is a momentum indicator that measures the degree and velocity of recent price changes to determine what is overbought and what may be oversold. We are simply not in any extreme condition according to the RSI principle.

Let’s see how the back half of September plays out and we will revisit the technical set-up of the markets in October. Good luck to all 🙂

~George

S&P 500 - George Mahfouz Jr


Finally A Tradable Market!

After years of essentially low to no volatility, traders finally get what they have been wishing for and that is a tradable market! In 2017 the markets witnessed the longest stretch of low vol in recent memory. In fact the VIX (see chart below) which is the ticker symbol for the Chicago Board Options Exchange volatility index traded in the 10 zone for most of 2017. The 10 level on the VIX (chart) is beyond abnormally low especially lasting for the better part of a year. Fast forward to today and the VIX is hovering around 20 after spiking to over 50 over the past two weeks. We haven’t seen the VIX (chart) at the 50 level in years. Call it long overdue, call it the market needed to correct, call it higher interest rates, call it what you want but finally we seemingly have more of a normal market environment. Not to say it wasn’t gut wrenching watching 1000 point Dow Jones Industrial Average (chart) intra-day swings over the past couple of weeks compared to the slow melt-up investors have enjoyed for years. Traders on the other hand have underperformed the markets during the melt-up because there simply was not enough or no volatility to be able to trade.

Stocks have indeed bounced sharply from the early February market correction. The Dow Jones Industrial Average (chart) closed the day up 307 points, the tech focused Nasdaq Composite (chart) closed up on the day 113 points, the S&P 500 (chart) closed up 32.5 points and the small-cap Russell 2000 (chart) finished the trading session up 15 points. Going forward I am certainly going to respect the technical make up of the aforementioned indexes and select stocks. Moving averages such as the 20-day, 50-day and 200-day tend to provide reliable support and resistance marks and now that we are out of the no vol environment, these moving averages tend to be more accurate and can be used to determined entries and exits in positions you hold and or trade. As I write this blog the key indexes have now rebounded to their 50-day moving averages so we will see if this technical indicator will act as resistance or if the markets can hold, breakthrough and proceed higher. Of course there is much more to consider when entering or exiting any position or strategy but when volatility comes back into the markets, most professional traders key in on the moving averages. Good luck to all 🙂

~George

VIX - Paula Mahfouz

Within Striking Distance!

In my previous blog, I said I wouldn’t be at the very least surprised if the Dow Jones Industrial Average (see chart below) closed above 25000 by year end. Well don’t look now, we are in striking distance of that milestone. In fact, if the Dow does close above 25000 by year end, it would have taken it a month to do so. That’s right only a month! In late November the Dow closed above the 24000 mark for the very first time and now its a mere 350 points away from yet another 1000 point gain. What’s impressive about this 1000 point clip is how fast it is getting there, I mean a month? This is unprecedented for sure. Market observers are expecting this insatiable bull market to keep on truckin into the end of the year, especially if the tax bill goes live! The S&P 500 (chart) and the Nasdaq Composite (chart) also closed at records highs on Friday with the S&P 500 closing in on the 2700 mark and the Nasdaq approaching the 7000 mark. The small-cap Russell 2000 (chart) is lagging behind but on Friday the Russell did find support at its 200-day moving average to close higher on the week.

With only 2 weeks left in the trading year what can investors or traders expect? More of the same or a sell the news type event? The news being the proposed tax bill getting through and going live. I truly don’t know? However, when you add seasonality into the mix with December being one of the strongest months for stocks on the year, I would not be surprised if the Dow Jones Industrial Average does indeed eclipse the 25000 mark. We could also see the S&P 500 overtake 2700 and the Nasdaq surpass 7000. Now if there is a snag in getting the tax bill through or if it ends up being a “sell the news” type of event meaning the proposed tax bill does go through by year end, then I will have a much different take heading into the new year. Both Paula and I wish everyone the healthiest and happiest holiday season 🙂

~George

Dow Jones Industrial Average - Paula Mahfouz

Where Is The Vol?

As the second quarter came to a close yesterday volatility is no where to be found. The CBOE Market Volatility Index also referred to as the VIX has been pretty much dormant this entire year (chart). Typically vol ticks up as we approach summer for a variety of reasons such as earnings reporting season, seasonality and of course the Federal Reserve policy actions. As expected the Fed did raise rates in June but the markets appear to be pricing in a higher interest rate environment. So far this year the Dow Jones Industrial Average (chart) is up 8.03%, the S&P 500 (chart) is up 8.24%, the Nasdaq Composite (chart) is up a whopping 14% and the small-cap Russell 2000 (chart) is up a modest 4.29%.

Seemingly everyday stocks are in melt-up mode. There are days where volatility tries to rear its head up, but that does not last very long. (See chart below). Even when Goldman Sachs came out with a bearish report on June 9th comparing the red-hot tech sector to the internet bubble era, the negative effect of that report lasted only a couple of days before tech found support and then proceeded to make new highs. The traders and investors that are waiting for the proverbial 10% or more correction are just not getting it. Buying the pullbacks is what has been working ever since the election but the problem is that if you are not stepping in on the 1-3% percent retracements, you are missing the next leg up. How much longer can this type of market environment last? Now that Q2 is in the books, earnings reporting season will soon begin. Let’s see if corporate earnings continue to come in stronger than analyst expectations and if so, stocks may just continue to remain bulletproof.

A quick gander at the technical shape of the aforementioned indexes and there are no signs of overbought or oversold conditions according the relative strength index. Therefore I am expecting vol to remain relatively low until at least second quarter earnings season begins. Good luck to all!

Both Paula and I wish everyone a very safe and happy Fourth of July holiday weekend 🙂

~George

VIX Chart - Paula Mahfouz

Stocks Are Back!

Since losing over 10 percent of their values and going into correction territory earlier this year, the major averages now find themselves almost back to par. Year-to-date the Dow Jones Industrial Average (chart)  is only down around one percent, the S&P 500 (chart) is also lower by around one percent, the Nasdaq (chart) on the year has gained back over half of its losses and the small-cap Russell 2000 (chart) is lower by 4.5%. Since this bull market began over seven years ago, time and time again stocks have demonstrated astounding resilience. Seemingly every time there is a sell-off, willing buyers are ready to step in at varying support levels and buy up equities.

Today the Federal Reserve left interest rates unchanged and actually slashed their forecast to project only two additional rate hikes for the rest of this year versus the four rate hikes they had originally targeted. Stocks initially popped on the news and only one can conclude that the continuing accommodating monetary policies not only here in the United States, but from around the world is most likely the reason why this seven year bull market continues.

That said, the aforementioned indices are approaching overbought conditions according to the relative strength index. Remember the RSI is one of the favorite technical indicators by market technicians, certain algorithmic programs and institutional investors alike. The relative strength index measures and compares the size of moves in a selected period of time and according to the RSI, the 70 or greater value level signals an overbought condition and the 30 value level or lower indicates an oversold condition. Keep in mind stocks and/or indexes can remain overbought or for that matter oversold for an extended period of time. Currently the Dow Jones Industrial Average (chart) is almost touching the 70 value level and the other indexes are not too far behind. Of course this is only one of many technical indicators that traders and investors utilize, but I have found over the years the RSI is one of the more reliable indicators out there.

Good luck to all 🙂

~George

Volatility Back In Vogue…

Since the start of the year there has been a very noticeable uptick in volatility in the marketplace. Twice over the past couple of months volatility has spike past the coveted 30 value level which is considered to be the level that demonstrates a large amount of investor uncertainty and/or fear. This you can see clearly in the chart of the Chicago Board Options Exchange Volatility Index, Symbol: VIX (chart). The VIX tracks the S&P 500 and calculates the next 30-day expectation of implied market volatility of a wide range of call and put options related to the S&P 500. Investors have not seen this type of volatility in quite some time and traders and short sellers have certainly taken advantage of it.

Let’s take a look at what the increase in vol has done to the major averages. Year to date the Dow Jones Industrial Average (chart) is down over five percent, the Nasdaq (chart) is lower by almost nine percent, the S&P (chart) is off by over five percent and the small-cap Russell 2000 (chart) is down almost nine percent on the year as well. That said, these key indices have bounced sharply off of their recent lows in mid-Feburary and crude oil (chart) has seemingly found a interim bottom around the $30 dollar level.

So now what? I am expecting volatility to continue throughout the month of March especially as we lead up into the upcoming Federal Reserve policy meeting March 15-16th. Most experts do not expect the Fed to raise interest rates at this meeting and furthermore not until the economic data consistently proves otherwise.  In fact, there are certain economists out there that think that the Federal Reserve is handcuffed for now and won’t raise rates until the fourth quarter because of the global turmoil that has surfaced this year especially in China and Europe. The current global equity sell-off is without question part of the reason for the increase in vol here in the United States. Whatever the case is, I will be listening to what tone and language Janet Yellen will use at her press conference post meeting to get a sense of what’s next for rates and how this will effect our markets.

Good luck to all 🙂

~George