Record Highs For Stocks!

Record highs for stocks are hitting the tape with both the Dow Jones Industrial Average (see chart here) and the S&P 500 (see chart here) hit all time highs yesterday. The Dow Jones Industrial Average hit a high of 38,588 while the S&P 500 traded at 4931 before closing slightly lower. However, the Nasdaq Composite (see chart here) and the Russell 2000 (see chart here) did not hit their all-time highs but the uptrend in those indexes continue.

So why are two of the major averages at all-time highs? For one I think the markets have been anticipating the Federal Reserve to start cutting interest rates this year. However, Fed Chair Jerome Powell yesterday said rate cuts in the near term is not likely. Suffice to say the markets did sell off yesterday after Chair Powell’s remarks. The other factor driving stocks higher is the undeniable strength our economy and the job market. The latest Gross Domestic Product (GDP) report surprised analysts yet again. Economists were expecting the GDP to come in at an annualized growth rate of 1.5%. Instead, the economy grew on an annualized basis of 3.3%. I’d say that’s a beat! The GDP is a measure used to evaluate the strength of the economy. The GDP is the total market value of the final goods and services produced in a given country.

Going forward without question the strength of the economy and job market, along with inflation, will be guiding the Federal Reserve as to the timing of when they will begin to cut rates. Until then, the strength of companies’ earnings results, geo political factors and our own political backdrop should be the catalysts that determine where the markets trade.

Last but not least, the technical backdrop of the key indexes is in decent shape. Yes, the Dow Jones Industrial and the S&P 500 did breach the 70 RSI level briefly but has retreated some since going into overbought territory. All in all, from a technical standpoint, I do not see any alarming trends.

Good luck to all πŸ™‚

~George


Cheers To The Markets!

Cheers to the markets and what a year for stocks! 2023 turned out to be a spectacular year for the stock market as not many expected the markets to rip-roar as it did last year. The Dow Jones Industrial Average (see chart here) finished the year up almost 14 percent. The S&P 500 (see chart here) closed the year up 24%. The Nasdaq Composite (see chart here) closed the year up a whopping 44 percent. A big part of the Nasdaq’s eye-popping performance was how the “Magnificent 7” performed. For those of you who do not know who the Magnificent 7 are, it is the big tech group made up of Apple (NasdaqGS: AAPL), Microsoft (NasdaqGS: MSFT), Google owner Alphabet (NasdaqGS: GOOGL), Amazon (NasdaqGS: AMZN), Nvidia (NasdaqGS: NVDA) and Meta Platforms (NasdaqGS: META) and Tesla (NasdaqGS: TSLA). Finally, the small-cap Russell 2000 (see chart here) closed the year up 15%.

Many stock market experts did not expect such a stellar year for stocks. Let’s dig in and see what happened. For starters, inflation itself retreated faster than anyone expected which now has the Federal Reserve speaking to cutting rates in 2024. This metric alone is very bullish for stocks. Then factor in how strong the economy has been it’s no wonder we are at or near all-time highs. What’s equally impressive is how the markets have shrugged off the geopolitical backdrop. From two wars that seemingly have no end is sight, to the U.S. political divide, to China’s stagnant economy, nothing seems to be bothering the markets, at least not yet.

As we now look forward to 2024, I think we are in for a doozy of a year, at least from a volatility standpoint. We are also in an election year, and this alone should create higher volatility. I would also expect that after such a strong performance in 2023 that a pause and/or even a correction of some sort could potentially be in the cards for the markets in general.

Wishing everyone the healthiest, happiest, and most prosperous new year πŸ™‚

~George

The Bounce Was Indeed Real…

In my November 1st blog, I asked the question was the bounce real? Fast forward to today and indeed the bounce the markets experienced in the early fall not only held but took off to and are nearing all-time highs. The Dow Jones Industrials (see chart here) closed yesterday at 36,245, the S&P 500 (see chart here) closed at 4,594 the Nasdaq Composite (see chart here) closed at 14,305 and the small-cap Russell 2000 (see chart here) finished the month out at 1,862.

It’s truly incredible to see how resilient the markets are considering the current interest rate environment and how inflation continues to impact the consumer. Rising interest rates tend to impact the stock market negatively and inflation impacts the consumer negatively too. So why are the markets approaching all-time highs? Could it be that the economy grew at a faster rate in the 3rd quarter than previously reported? Or could it be that the Federal Reserve may be ready to slow down or pause its current interest rate policy? I am not sure on either front, but what is apparent is that the markets are brushing off the current backdrop of Fed’s economic policy and the ongoing inflationary pressures. One thing I have learned over the years is the trend is your friend and these markets continue to trend up.

That being said, let’s look at a key technical indicator that many traders and investors rely on to see if we are approaching or at overbought conditions. According to the Relative Strength Index aka the RSI both the Dow Jones Industrial Average (see chart here) and the S&P 500 (see chart here) have crossed and are trading above the 70 value level. The 70-value level according to the relative strength index is the beginning of overbought conditions. The Nasdaq Composite (see chart here) and the Russell 2000 (see chart here) are fast approaching the 70-value level. I do want to point out that stocks and indexes can remain overbought for extended periods of time, but I would not be surprised if we see somewhat of a pause or possibly a reversal here in the month of December to this very impressive rally we are currently in.

It’s always a good idea to consult a certified financial advisor before making any adjustments to your portfolio. Good luck to all πŸ™‚

~George

Rally Caps Are On!

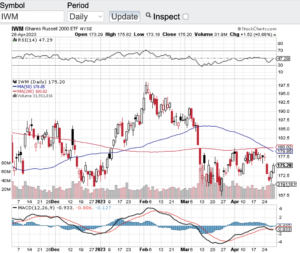
After breaching all moving average support lines including the 200-day, the major averages have their rally caps on! The Dow Jones Industrial Average (see chart here) finished the month of April on a high note. The same can be said for the S&P 500 (see chart here), the Nasdaq Composite (see chart here) and the small-cap Russell 2000 (see chart here and below).

After a slow start to the year including a brief dance with a bear market, stocks have rallied recently to turn green. Even the small-cap Russell 2000 is now green for 2023. So, what is causing the renewed bullish action? In part I think a stronger than expected first quarter earnings results have played a role in this latest bull run along with the Federal Reserve potentially slowing down their interest rate hike program. Positive earnings surprises have come from the health care sector, consumer discretionary and Industrials sector. It’s not just better than expected earnings results, it’s the top line revenue numbers that are also coming in stronger than expected. These data sets are great to see but we still do have some headwinds with inflation remaining high which means the Federal Reserve may not be quite done yet with higher rates.

When I take a look at the technical shape of the markets, there are some encouraging signs that may play a role in the continuation of this latest bull run. It appears that the Dow Jones Industrial Average (see chart here) is breakout out of a month’s long trading channel, as is the S&P 500 (see chart here) and the Nasdaq Composite (see chart here) also appears to be breaking out. I also see that the aforementioned indexes have not yet breached the 70 value level of the Relative Strength Index aka the RSI. The 70-value level of the RSI is considered the beginning of overbought conditions and we are not there yet.

Let’s see how the month of May goes and we will check back on the technical shape of the markets in June. Good luck to all πŸ™‚

~George

Rally Caps Are On! - Paula Mahfouz

The 200-Day Breached…

In my March blog I highlighted the 200-day moving average and questioned whether or not this key support zone would hold on the major averages. Low and behold the 200-day moving averages were breached for the better part of the month only to come roaring last week. The Dow Jones Industrial Average (see chart here) closed the month up slightly at 33274, the S&P 500 (see chart here) also closed in the green at 4109, the Nasdaq Composite (see chart here) closed the month up at 12221 points, however the small-cap Russell 2000 (see chart here) did not recapture its 200-day and closed the month of March lower at 1802.

As mentioned above, although the markets experienced heavy selling pressure last month which was fueled by the collapse of Silicon Valley Bank, in the final the week of March the markets experienced a meaningful rally which propelled most of the major averages right back through their respective 200-day. The response to this 200-day breach and how the major averages blew right past this technical line is seemingly bullish.

With the first quarter in the books market participants will now begin to focus on Q1 earnings reporting season to see how well corporate America is doing. Last month there was the shock of Silicon Valley Bank failing and that certainly drew the attention of the Federal Reserve. This event may guide the Fed going forward to change their current interest hike program. If the Fed starts easing interest rate hikes this could help the overall selling pressure that the markets have experienced so far this year. Furthermore, if Q1’s earning reporting season goes better than expected or at least if companies guide up a bit, this may be enough to quell the selling.

Let’s see what is in store for April and hopefully we continue to see the selling pressure ease up. Good luck to all πŸ™‚

~George

Will It Hold?

As the markets closed out the month of February, the major averages are approaching a key technical point and the question now becomes, will it hold? As stocks continue to exhibit volatility the major averages are now approaching their 200-day moving average. Institutional investors, hedge funds andΒ  individual investors view the 200-day moving average as a key support technical indicator. Historically when indexes or individual stocks gravitate to their 200-day support level at minimum some sort of bounce occurs from this key support line. If you go back over time whether it’s months or years and look at what happens when stocks or indexes retrace to their 200-day, this will demonstrate how powerful this support line can be. Now there is no guarantee that the 200-day will hold every time and reverse its course but see for yourself how this dynamic historically performs.

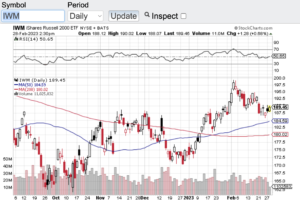
The Dow Jones Industrial Average (see chart here) is in striking distance of its 200-day moving average which is currently at the 32355 level. The S&P 500 (see chart here) is only about 90 points away from its 200-day. The Nasdaq Composite (see chart here) almost touched its 200-day yesterday and the small-cap Russell 2000 (see chart here and below) is currently further away from its 200-day compared to the Dow Jones, Nasdaq Composite, and the Russell 2000. So technically speaking the small caps are currently in a better technical set up vs the other major averages.

As far as what to expect here in March, I think things will continue to be a bit choppy and should the indexes continue to retrace and end up at or near their 200-day moving average, let’s see how this technical indicator responds should it get there. As always, please consult with certified financial planners before you make any moves or adjustments in your portfolio.

Good luck to all πŸ™‚

~George


Trying To Make Up Its Mind!

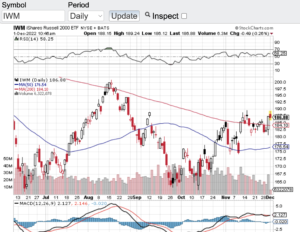
Seemingly, the markets are trying to make up their mind on whether to breakout or breakdown. Over the past couple weeks, the Dow Jones Industrial Average (see chart here), the S&P 500 (see chart here), the Nasdaq Composite (see chart here) and the small-cap Russell 2000 (see chart here and below) have all been consolidating in a very tight trading range. As you can see in the charts of these major averages, consolidation has occurred while also finding support at their 100 and 200-day moving averages. These tight trading ranges along with moving average support bodes well for an inevitable break from this current trading range . The question is will the markets breakout before year end or breakdown and through their respective moving averages support lines?

Let’s face it, we are currently in a bear market and rightfully so. It has been repulsive to see how inflated asset prices were during the heart of the pandemic. Stimulus was abound, interest rates remained at all-time lows and then speculation went from reasonable to very disturbing. This recipe set up the bear market and then Federal Reserve launched it by aggressively raising interest rates. My comment to that is what took them so long? The Fed had no choice to but to start raising rates and inflation took off to levels not seen in over 40 years. The silver lining to all the above is that finally we are moving towards a market that is now more trustworthy. Trustworthy from the standpoint that stocks may actually start trading at reasonable levels to where opportunities can be found. In fact, it is possible that certain stocks and sectors for that matter will overshoot to the downside to where great opportunities could come to the forefront.

As mentioned above, stocks are currently trading in a tight trading range and have support at their moving averages. However, with year-end approaching and as traders and investors reposition their portfolios I would not be surprised if we exit this tight trading range the markets have been in.

Good luck to all πŸ™‚

~George

A Tough Quarter For Stocks…

It was a tough quarter for stocks as the markets dealt with and continues to deal with the war in Ukraine, runaway inflation, rising interest rates and the seemingly never ending Covid dynamic. For Q1, both the Dow Jones Industrial Average (see chart here) and the S&P 500 (see chart here) lost nearly 5%. The Nasdaq Composite (see chart here) lost more ground closing out the quarter down 9%. Last but not least, the small-cap Russell 2000 (see chart here )Β  also closed Q1 down 9 %.

As mentioned above, it was a tough quarter for stocks and indexes but with the current state of global backdrop my feelings are we are quite lucky to not of experienced more of a drawdown. In fact, I am very surprised if not shocked that we did not see a 20 percent sell-off or more due to these major headwinds. So, this begs the question as to why there was not more of a correction? Could it be corporate earnings will surprise the street once Q1 earnings reporting season kicks off here in April? Or could it be that while interest rates are going up and will continue to do so, that rates are still relatively low, and money continues to get put to work in the overall markets? I do think that this upcoming earnings reporting season will be one of the most important metrics in years pertaining to whether stocks find their footing or continue to be under pressure. The one other metric I will be paying close attention to is yield curve inversion. For the first time in years the 2-year Treasury yield surpassed the 10-year and historically when that happens the chances for a recession increase. So, as you see there is much to learn over the coming weeks and throughout the summer.

Last but not least, when I look at the current technical shape of the aforementioned key indexes, all of them are trading right around their respective 20-day, 100-day and 200-day moving averages. Based on this action it is possible that we see a breakout above and/or a breakdown below these historic support and resistance lines.

Good luck to all πŸ™‚

~George


Volatility Hits The Markets…

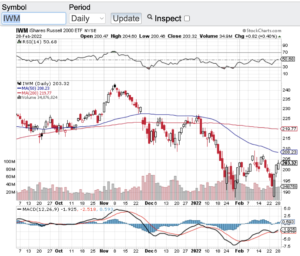
Volatility has hit the markets to the point that the VIX (see chart here) aka the fear gage has broken out. Stocks have been on a tear as of late but unfortunately to the downside. No one is surprised that the markets have become extremely volatile due to the Russian invasion of Ukraine. The Dow Jones Industrial Average (see chart here) fell over 10% since the crisis began as has the S&P 500 (see chart here). Both the Nasdaq Composite (see chart here) and the small-cap Russell 2000 (see chart here and below) have sold off closer to 15% before bouncing off of their sell-off lows. Again, no surprise that vol has spiked to almost a double over the past few weeks as tensions increased.

Before we get into the technical shape of the markets it’s hard for me to even talk stocks and indexes due to the atrocities happening abroad. Our prayers go out to everyone in the Ukraine that is being affected by this invasion and for the people of Russia who wants no part of this. Hopefully very soon a cease fire will happen and happen for good!

Now let’s look at the technical set-up that has occurred since the buildup and invasion with the aforementioned key indexes. Starting with the Dow Jones Industrial Average (see chart here). The Dow a few days ago hit a low of 32272 and has bounced to the 34,000 zone. There is much more work here to be done before the Dow can recapture its 100 and 200-day moving averages. The same can be said for the S&P 500 (see chart here) although with the S&P, it is closer to its 20-day M/A than the Dow Jones Industrials Average. Interestingly both the Nasdaq Composite (see chart here) and the small-cap Russell 2000 (see chart here) have bounced off of their recent lows stronger with the Russell 2000 recapturing its 20-day M/A. Despite the recent bounces off of their sell-off lows I think it is fair to say that we are not out of the woods yet in the volatility we have seen as of late. If you are a long-term investor, this will pass at some point in time. For experienced traders this is an environment where money can be made both on the long and short side of the markets. That said, I always recommend consulting your certified professional financial advisor(s) before making any moves in the backdrop we currently find ourselves.

Good luck to all πŸ™‚

~George

Volatility Hits The Markets - Paula Mahfouz

The 200-Day Recaptured!

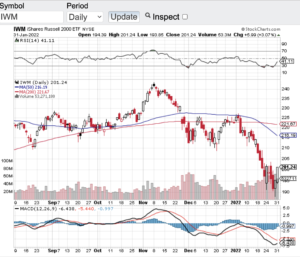
On the last trading day of January, both the Dow Jones Industrial Average (see chart here) and the S&P 500 (see chart here) recaptured and closed above their 200-day moving averages. Why is this important to note? The 200-day moving average of any index or stock for historically acts as significant support in an uptrend and in a downtrend can act resistance. Since the first half of the new year both of these indexes have sold off to the extent of breaching their 200-day moving averages. This can also be said for the Nasdaq Composite (see chart here) and the small-cap Russell 2000 (see chart here). What’s different right now amongst these key indexes is that the Nasdaq and Russell (see chart below) remain below their respective 200-day with some work to do. Let’s see if these two bellwethers can catch up to the Dow and S&P 500.

Headwinds do remain in the economy including inflation and now the backdrop of an upcoming rising interest rate environment. I think if the Federal Reserve manages their interest rate hikes in a methodical manner and communicates effectively to the street of their intentions, I don’t think the markets will be disrupted too much. Of course, geopolitical events such as the potential of Russia invading Ukraine and North Korea engaging once again in missile tests, these dynamics depending how they play out could impact the markets in the near term and the downtrend we witnessed last month could resume. Hopefully both geopolitical events turn out to be no more than a threat vs a reality.

Notwithstanding the above, I do see some hope with the pandemic numbers as of late. It does appear the spike in infections due to the omicron variant seem to have peaked which is great news for our country and the world for that matter. Hopefully soon there could be some semblance of normality which could be the catalyst for the recent downtrend in the markets to reverse its course as well.

Good luck to all πŸ™‚

~George

The 200-Day Recaptured! - Paula Mahfouz