2021 Is Here…

2021 is here and it could not of come fast enough. Happy New Year and I think we can all use a fresh start! The year 2020 was one of the most challenging years our country and the world has faced. One of the only exceptions that did not face many challenges is the stock market. Despite the global pandemic we remain in and the non-stop chaos out of Washington DC, the major averages set record highs throughout the year. Who would of thought that stocks and market speculation would be at such a fever pitch considering the backdrop of 2020. During this latest bull market surge one thing that stands out to me is how margin debt has hit all time highs. Investors have borrowed over $700 billion dollars against their portfolios which is also a new record. This is somewhat alarming because when the market experiences a correction, margin debt can accelerate any meaningful selloff. Some investors could be forced to sell if their margin debt becomes disproportionate to their overall account value. That said, when record highs continue to be set the risk of margin debt tends to be overlooked.

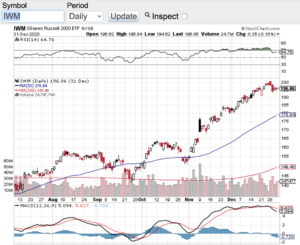
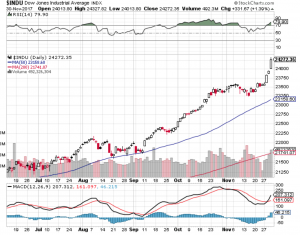
Speaking of record highs, both the Dow Jones Industrial Average (see chart here) and the S&P 500 (see chart here) set new records on the last trading day of the year. The Nasdaq Composite (see chart here) and the Russell 2000 (see chart below) also set records earlier in the week. Although stocks and indexes feel overbought, we are not seeing extreme overbought conditions according the the relative strength index also know as the RSI. There is also support in place at the 20-day, 50-day, 100 and 200-day moving averages. So technically speaking the key indices appear to be in good shape. This set-up bodes well for the continuation of the market rally that we are in.

Of course there are risks out there that could temper the record setting enthusiasm. One risk in particular is the upcoming runoff election in Georgia next week. If the democrats take control of the Senate, this could be viewed as a negative for stocks. The markets historically have liked when there is a split majority between the House and Senate. Pundits argue that a Democratic President and a Democrat controlled Congress could affect income and capital gains taxes that would negatively impact stocks. I am not sure if this will play out but nonetheless as we continue down this bull market path we should not be lullabied to sleep with the risks out there. Good luck to all ๐Ÿ™‚

~George

2021 Is Here - Paula Mahfouz

The T-Word Has Done It Again!

No question the T-word has done it again aka tariffs. The week started off with China’s retaliation to the Trump tariffs with a market sell-off on Monday sending the Dow Jones Industrial Average (see chart here) down 600 points. The trade war also sent volatility soaring earlier in the week as well $VIX (see chart below).ย This after the market set all-time highs. No matter what the case is, stocks will continue to sell-off on any negative tariff news. Why not? Tariffs can essentially act as a tax on American businesses and the consumer at least in the short term.ย  Without question the tariff tape bombs have hit the market and had nearly doubled the price of vol over the past week or so. (see chart here)ย 

Now that the wild market swings are back, what’s next? Whenever I see a pick up in vol I take a closer look at the technical shape of the key indexes. Let’s start with the Dow Jones Industrial Average (see chart here). Since volatility kicked back in the Dow Jones Industrial Average lost around 1000 points, but found support at its 100 and 200-day moving averages and bounced off of those key support levels. The S&P 500 (chart) also sold off sharply over the past week or so but it too bounced off of key support zones. The Nasdaq Composite (chart) sold off almost identical to the S&P and bounced back nicely.ย  Last but not least, the small-cap Russell 2000 (chart) actually fell through its 200-day moving average and found support at its 100-day. So technically speaking and if you are in the bull camp this is a very good sign for the continuation of the latest upward trend in the market. I am always a fan of pullbacks that meet support, holds that support and resumes its uptrend and that’s what we seemingly have now.

Let’s see if we get any positive developments on the trade war to calm the markets down a bit. Good luck to all ๐Ÿ™‚

~George

$VIX - george mahfouz

Trade War Back On!

Here we go again, the trade war is back on! Donald Trump yesterday once again fired up the trade war this time including the EU, Mexico and Canada. How is an investor supposed to confidently invest when the message and policies of our government change almost daily. Stocks all week have been whipsawed around which is great for the trader, but no so much for the investor. Now we have countries from around the world retaliating with their own tariffs on our goods. The Dow Jones Industrial Average (chart) finished the week at 24635, the S&P 500 (chart) closed the week out at 2734, the Nasdaq Composite (chart) closed at 7554 and the small-cap Russell 2000 (see chart below) showing its incredible resilience finishing the week out near an all-time high.

The chop action that we are seeing in the markets along with the unpredictably of our government gives me more reason now to focus in on the technical trading patterns of stocks and indices. Whether it is support or resistance levels vis ร  vis moving averages (click here) i.e. the 20-day, 50-day, 100-day, 200-day or outright overbought or oversold conditions using the Relative Strength Index (click here) or the Bollinger Bands (click here) which can also provide a technical look into extreme conditions. With Q1 earnings reporting season essentially wrapped up, there is no real apparent catalyst to move the markets in a meaningful way. Which is why I will be paying much closer attention to the technical make up of the markets to identify opportunities.

One of my favorites are the moving averages (click here) especially the 200-day moving average. For example, just take a look at the Dow Jones Industrial Average (chart) and the S&P 500 (chart). You’ll see over the past few months each time these indexes gravitated to their respective 200-day MA, they found support and proceeded higher. There is no guarantee that moving averages will always hold and provide support, but in many instances it indeed acts as a short term floor to selling pressure. There are many resources on how technical analysis can work and I would recommend studying the dynamics of TA before including it in your investment or trading strategies. Good luck to all ๐Ÿ™‚

~George

Russell 2000 - Paula Mahfouz


Finally A Tradable Market!

After years of essentially low to no volatility, traders finally get what they have been wishing for and that is a tradable market! In 2017 the markets witnessed the longest stretch of low vol in recent memory. In fact the VIX (see chart below) which is the ticker symbol for the Chicago Board Options Exchange volatility index traded in the 10 zone for most of 2017. The 10 level on the VIX (chart) is beyond abnormally low especially lasting for the better part of a year. Fast forward to today and the VIX is hovering around 20 after spiking to over 50 over the past two weeks. We haven’t seen the VIX (chart) at the 50 level in years. Call it long overdue, call it the market needed to correct, call it higher interest rates, call it what you want but finally we seemingly have more of a normal market environment. Not to say it wasn’t gut wrenching watching 1000 point Dow Jones Industrial Average (chart) intra-day swings over the past couple of weeks compared to the slow melt-up investors have enjoyed for years. Traders on the other hand have underperformed the markets during the melt-up because there simply was not enough or no volatility to be able to trade.

Stocks have indeed bounced sharply from the early February market correction. The Dow Jones Industrial Average (chart) closed the day up 307 points, the tech focused Nasdaq Composite (chart) closed up on the day 113 points, the S&P 500 (chart) closed up 32.5 points and the small-cap Russell 2000 (chart) finished the trading session up 15 points. Going forward I am certainly going to respect the technical make up of the aforementioned indexes and select stocks. Moving averages such as the 20-day, 50-day and 200-day tend to provide reliable support and resistance marks and now that we are out of the no vol environment, these moving averages tend to be more accurate and can be used to determined entries and exits in positions you hold and or trade. As I write this blog the key indexes have now rebounded to their 50-day moving averages so we will see if this technical indicator will act as resistance or if the markets can hold, breakthrough and proceed higher. Of course there is much more to consider when entering or exiting any position or strategy but when volatility comes back into the markets, most professional traders key in on the moving averages. Good luck to all ๐Ÿ™‚

~George

VIX - Paula Mahfouz

An Earnings Bonanza!

Earnings reporting season is now in full swing and so far the numbers are not too shabby. A couple of earnings standouts so far are Netflix (NasdaqGS: NFLX) and Boeing (NYSE: BA). Netflix saw subscriber and revenue growth both exceed analyst’s expectations and their stock has skyrocketed since their earnings release last week. Boeing which reported before the bell yesterday also knocked the cover off the ball as the company nearly doubled its net income from the prior period a year ago. A company doubling its net income may not sound like a lot, but when you go from $1.63B in net income to $3.13B that is clearly moving the needle in a fascinating way. Boeing shareholders were also rewarded yesterday as the stock traded north of $350.00 per share hitting all-time highs. I am just highlighting a couple of standouts so far with hundreds of companies set to report over the coming days and throughout the next few weeks.

After a 2 day mini sell-off to start the week the key indexes did bounce back yesterday and resumed itsย  uptrend. The Dow Jones Industrial Averageย (chart) closed the month of January above 26,000, the S&P 500 (chart) closed out the month at 2823.81, the Nasdaq Composite (chart) closed at 7411.48 and the small-cap Russell 2000 (chart) closed at 1575. Even with the first noticeable sell-off earlier in the week the aforementioned indexes did have a stellar performance in January gaining more than 5% on the month.

I will say this, earlier in the week and for the first time in almost 2 years the market did feel vulnerable and the sell-off felt a bit different than recent pullbacks. Pundits are suggesting that interest rates may be playing a role in the volatility for the first time in years. I have been tracking the yield on the U.S. 10 year Treasury Note (Symbol: TNX) and for the first time in a long time the yield exceeded 2.7%. A break above 3% for an extended period of time could cause volatility to continue in stocks and may be the very first catalyst to put the brakes on this almost decade long bull run. Let’s see how the rest of earnings reporting season plays out and how interest rates fare in February before we can draw any type of conclusion. Good luck to all ๐Ÿ™‚

~George

New Year, New Records?

Happy New Year! Will 2018 be a new year of new records? Nothing would surprise me. Especially as the Dow Jones Industrial Average (chart), the S&P 500 (chart), the Nasdaq (chart) and the small-cap Russell 2000 (chart) shattered record after record after record in 2017. In fact the Dow Jones Industrial Average set 70 record closing highs in 2017. That’s not a typo folks, 70 record closing highs. The other aforementioned key indices also set multiple record highs throughout last year. So could we see a repeat performance in 2018? I don’t know about another 70 record highs this year but I would not be surprised to see continuing strength in the markets in 2018. Yes the Federal Reserve is now in a rate hike mode which typically does not bode well for stocks, but this Fed and central banks from around the world understand the need to go about their new rate hike policies in a gradual manner. Raising rates too aggressively could be the exact catalyst to put the brakes on this almost decade long bull market. I don’t think this will be the case at least with our own Federal Reserve. Jerome Powell will be replacing Janet Yellen in early February as our new Federal Reserve Chairman. Mr. Powell who has been a member of the Federal Reserve’s board of governors since 2012 has voted for keeping interest rates at bay while the economy continues to recover.

Speaking of the economy, expansion continues to occur and we will soon find out how our economy isย  trickling down into corporate America. Fourth quarter earnings reporting season will begin here in January and this could very well serve as a key catalyst for the continuation of the bull market. That said, I think most investors and traders are looking for the markets to pause and pullback from this historic run we continue to be on. It is truly breathtaking to witness the record pace that stocks have enjoyed for years now. Personally, I hope and some point in time we do get a meaningful pullback so we can have the opportunity to step in at lower prices. Good luck to all and Paula and I wish everyone the healthiest and happiest new year! ๐Ÿ™‚

~George

Dow 24,000 – Bitcoin $10,000 – Why Not?

Is this really happening? Stocks exploded to the upside on the last trading day of November. For the first time in its history, the Dow Jones Industrial Average (see chart below) traded, blew through and closed above the 24,000 mark. The Dow started the year just under 20,000 and no one and I mean no one in the who’s who of finance, analysis, technical analysis, hedge funds, institutional investors and the like, ever predicted this type of performance for stocks and the key indices on the year. I cannot even count the number of record highs that have occurred this year not only in the Dow Jones Industrials, but also the S&P 500 (chart), the Nasdaq composite (chart), and the small-cap Russell 2000 (chart). Let’s throw in Bitcoin and its year to date 10X performance and we are truly in party mode.

I am not even sure what to think? This eerily feels like the irrational exuberance environment that occurred in the mid to late 90’s and before the internet bubble imploded. However the bullish pundits are quick to point out that this time is different. Back then, whoever came out with an announcement that they just launched a website saw their stock go up. Now the pundits are pointing out that it is earnings and growth that are responsible for this torrid record setting pace we have been on all year long. This is true to some degree. But what about the euphoria in Bitcoin? What is the catalyst that has propelled this so call asset to fly up over 10 times this year? This is why the other side of the camp thinks we are approaching a bubble or at the very least nose bleed territory. Without question I feel that something is going on that makes one have to pause and take a breather here. But as we have seen all year long, don’t underestimate the power of momentum, a low interest rate environment and the Trump trade. Is it possible that the Dow Jones Industrials actually could close above 25,000 by year end? As much as I want to say and think “no way”, way! Not saying the Dow will go up another 800 points by year end, but if we do, I would not be at the very least surprised.

Good luck to all ๐Ÿ™‚

~George

Dow Jones Industrial Average - George Mahfouz Jr

Russell 2000 – All Time High!

So now the small-caps join in! The Russell 2000 (chart) closed the week at an all time record high of 1490. For most of the year the widely followed small-cap Russell 2000 has lagged the other major averages. Now it has broken out, see (chart). In fact, when you look at the chart of the Russell, one can say this index has gone parabolic. The Nasdaq (chart) and the S&P 500 (chart) also closed at their all time highs on Friday, while the Dow Jones Industrial Average (chart) posted yet another positive week. What’s more is the month of September is typically one of the weakest months of the year for equities losing on average of 1.5% happening 70% of the time since the 1970’s. Not this year, in fact there have been so many record-breaking closes on all of the aforementioned indices it’s hard to keep track.

Question is, now what? With the third quarter of the year now in the books, Q3 earnings reporting season is right around the corner. I have got to believe with the Federal Reserve closing the chapter on their quantitative easing policy and now taking those assets off of their books, plus interest rates scheduled to rise, investors should pay closer attention to the health and growth of corporate earnings. Do you remember the days when earnings and earnings growth actually mattered? Well those days may be back upon us. Hence, the report cards that come in from corporate America may actually move the markets in a fundamental way. This we have not seen in almost a decade. However, if the market momentum that we have experienced since the election continues, and investors ignore the fundamentals, then why couldn’t we end the year at even higher highs?

One thing for sure is October will be filled with many catalysts that should bring in some volatility and a lot of opportunity.ย  Between now and year end may be the time to implement a hedged strategy where one can potentially profit regardless of how the indexes or individual stocks react to what’s ahead. I’ll cover this in my next blog. Good luck to all. ๐Ÿ™‚

~George

The Bears Are Baffled!

What is historically one of the weakest months of the year for stocks, the S&P 500 (chart) closed the week and halfway point of the month at an all time high of 2500. The Dow Jones Industrial Average (chart) also closed the week at a record high, along with the tech-focused Nasdaq (chart) and last but not least, the small-cap Russell 2000 (chart) appears to be closing in on a new record high as well.

The bear camp has to be completely exhausted. I mean how in the world can you have the confidence to short this market? Not even the continuation of North Korea’s missile launches can slow down one of the most significant bull markets in history. Now seemingly we need to throw out all traditional metrics, seasonalities, geo-political risks, price to earnings ratios etc. This market has been immune to any risks. I have never seen anything like this. What’s more, there are survey’s out there that indicate that professional investors are the most pessimistic about the markets since before the election. You know what that means? Stocks tend to act the opposite of street sentiment.

Over the years and as most of you know one of my favorite technical indicators and one of the preferred technical indicators of money managers and institutional trader alike is the relative strength indicator. This indicator has been a trusted source to spot overbought and for that matter oversold conditions. The problem I have encountered this year is when indexes or individual equities have reached an overbought condition according to the RSI, the pullbacks that ensue have not provided the proper risk reward to any short thesis. The retracements are so shallow and short-lived that it is not worth putting the trade on. So needless to say, this strategy is on hold for now.

I am not sure what will be the catalyst for stocks or indexes to begin trading on pure fundamentals and not on the oversupply of liquidity and low interest rates. Until then, I will be very cautious in using the traditional metrics and/or technical indicators to base my decisions off of. Good luck to all ๐Ÿ™‚

~George

Is Gold Breaking Out?

It certainly appears that way. Gold (see chart below) has caught a meaning bid as of late and it’s about time. The yellow medal has been stuck in a trading range between $1200 and $1300 per ounce for months and now has broke through the $1300 level currently trading around $1330 per ounce. What has surprised me is how long it took for gold to finally go from the left side of the chart to the right. Especially considering the geopolitical risk environment we find ourselves in. That said, stocks are saying what risk? As I write this blog, the Dow Jones Industrial Average (chart), the S&P 500 (chart), the Nasdaq (chart) and the small-cap Russell 2000 (chart) once again are all approaching all time highs. This after a very modest pullback in August. So Wall Street continues to remain in the “buy the dip” mood. All year long and every single time stocks experience any type of pullback, buyers come in and lift the markets to all time highs.

How long can this last? From a technical standpoint the key indices remain below the 70 value level of the relative strength index also referred to as the RSI. The RSI is used as a gauge by certain market technicians to see if whether or not stocks in the short term are overbought or oversold. As as these indexes approach all-time highs and should they breakthrough those highs, these markets can and should continue to go higher. However, if they do not breakout here, then one could expect yet another pullback especially as we are now in one of the more underperforming months for equites of the year. Historically September and October for that matter tends to be a difficult time for the markets. However, based on what we have witnessed all year long despite the ongoing geopolitical risks and with interest rates on the rise, the markets may not care about the seasonality trends of September and October. Good luck to all and both Paula and I wish everyone a safe and relaxing Labor Day Weekend ๐Ÿ™‚

~George

Gold chart - Paula Mahfouz