Stocks Are Jittery…
I think it is apparent now that stocks are jittery! The constant barrage of chaos coming out of Washington is catching up to stocks and crypto alike. Over the past weeks volatility has reared its head whipping around the stock market and other asset classes.
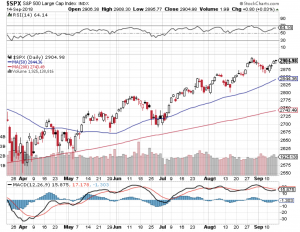
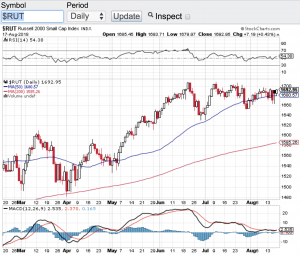
The Dow Jones Industrial Average (see chart here) closed the month of February at 43840, the S&P 500 (see chart here) ended the month out at 5954, the Nasdaq Composite (see chart here) finished at 18847 while the small-cap Russell 2000 (see chart here) closed the month out at 2163.
Stocks never like uncertainty and unfortunately we have now entered a period of abundant uncertainty. The uncertainty of how the new tariffs our country is imposing on our trade partners and how that will impact our country, how the 10’s of thousands of jobs that are being eliminated will impact our economy and labor market, to the threats of invading and taking over other countries. It is no wonder why the volatility index: Symbol: $VIX (see chart here) has spiked recently. So what in the world is going on? Pundits are scratching there heads as to why our government is now pretty much bulldozing so many key areas of the economy and key relations that are crucial for sustainable economic growth. I don’t want to get too political here but what is for sure, markets do not like uncertainty and that is showing up now.
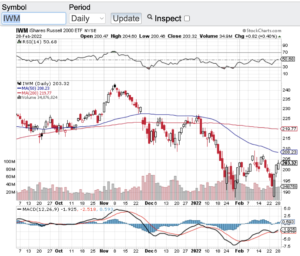
As I look at the technical shape of the stock market, the Dow Jones Industrial Average (see chart here) is smack in the middle of its 50-day moving average after a pullback of over 1000 points. The S&P 500 (see chart here) is now trading below its 50-day moving average with its 200-day M/A a little over 100 points away. The Nasdaq Composite (see chart here) on Friday actually touched its 200-day M/A and bounced, while the small-cap Russell 2000 (see chart here) has closed below its 200-day moving average.
Let’s see how the month of March responds to the recent market action and hopefully the volatility we saw in February will subside.
Good luck to all 🙂
~George