Best Monthly Performance In Decades!

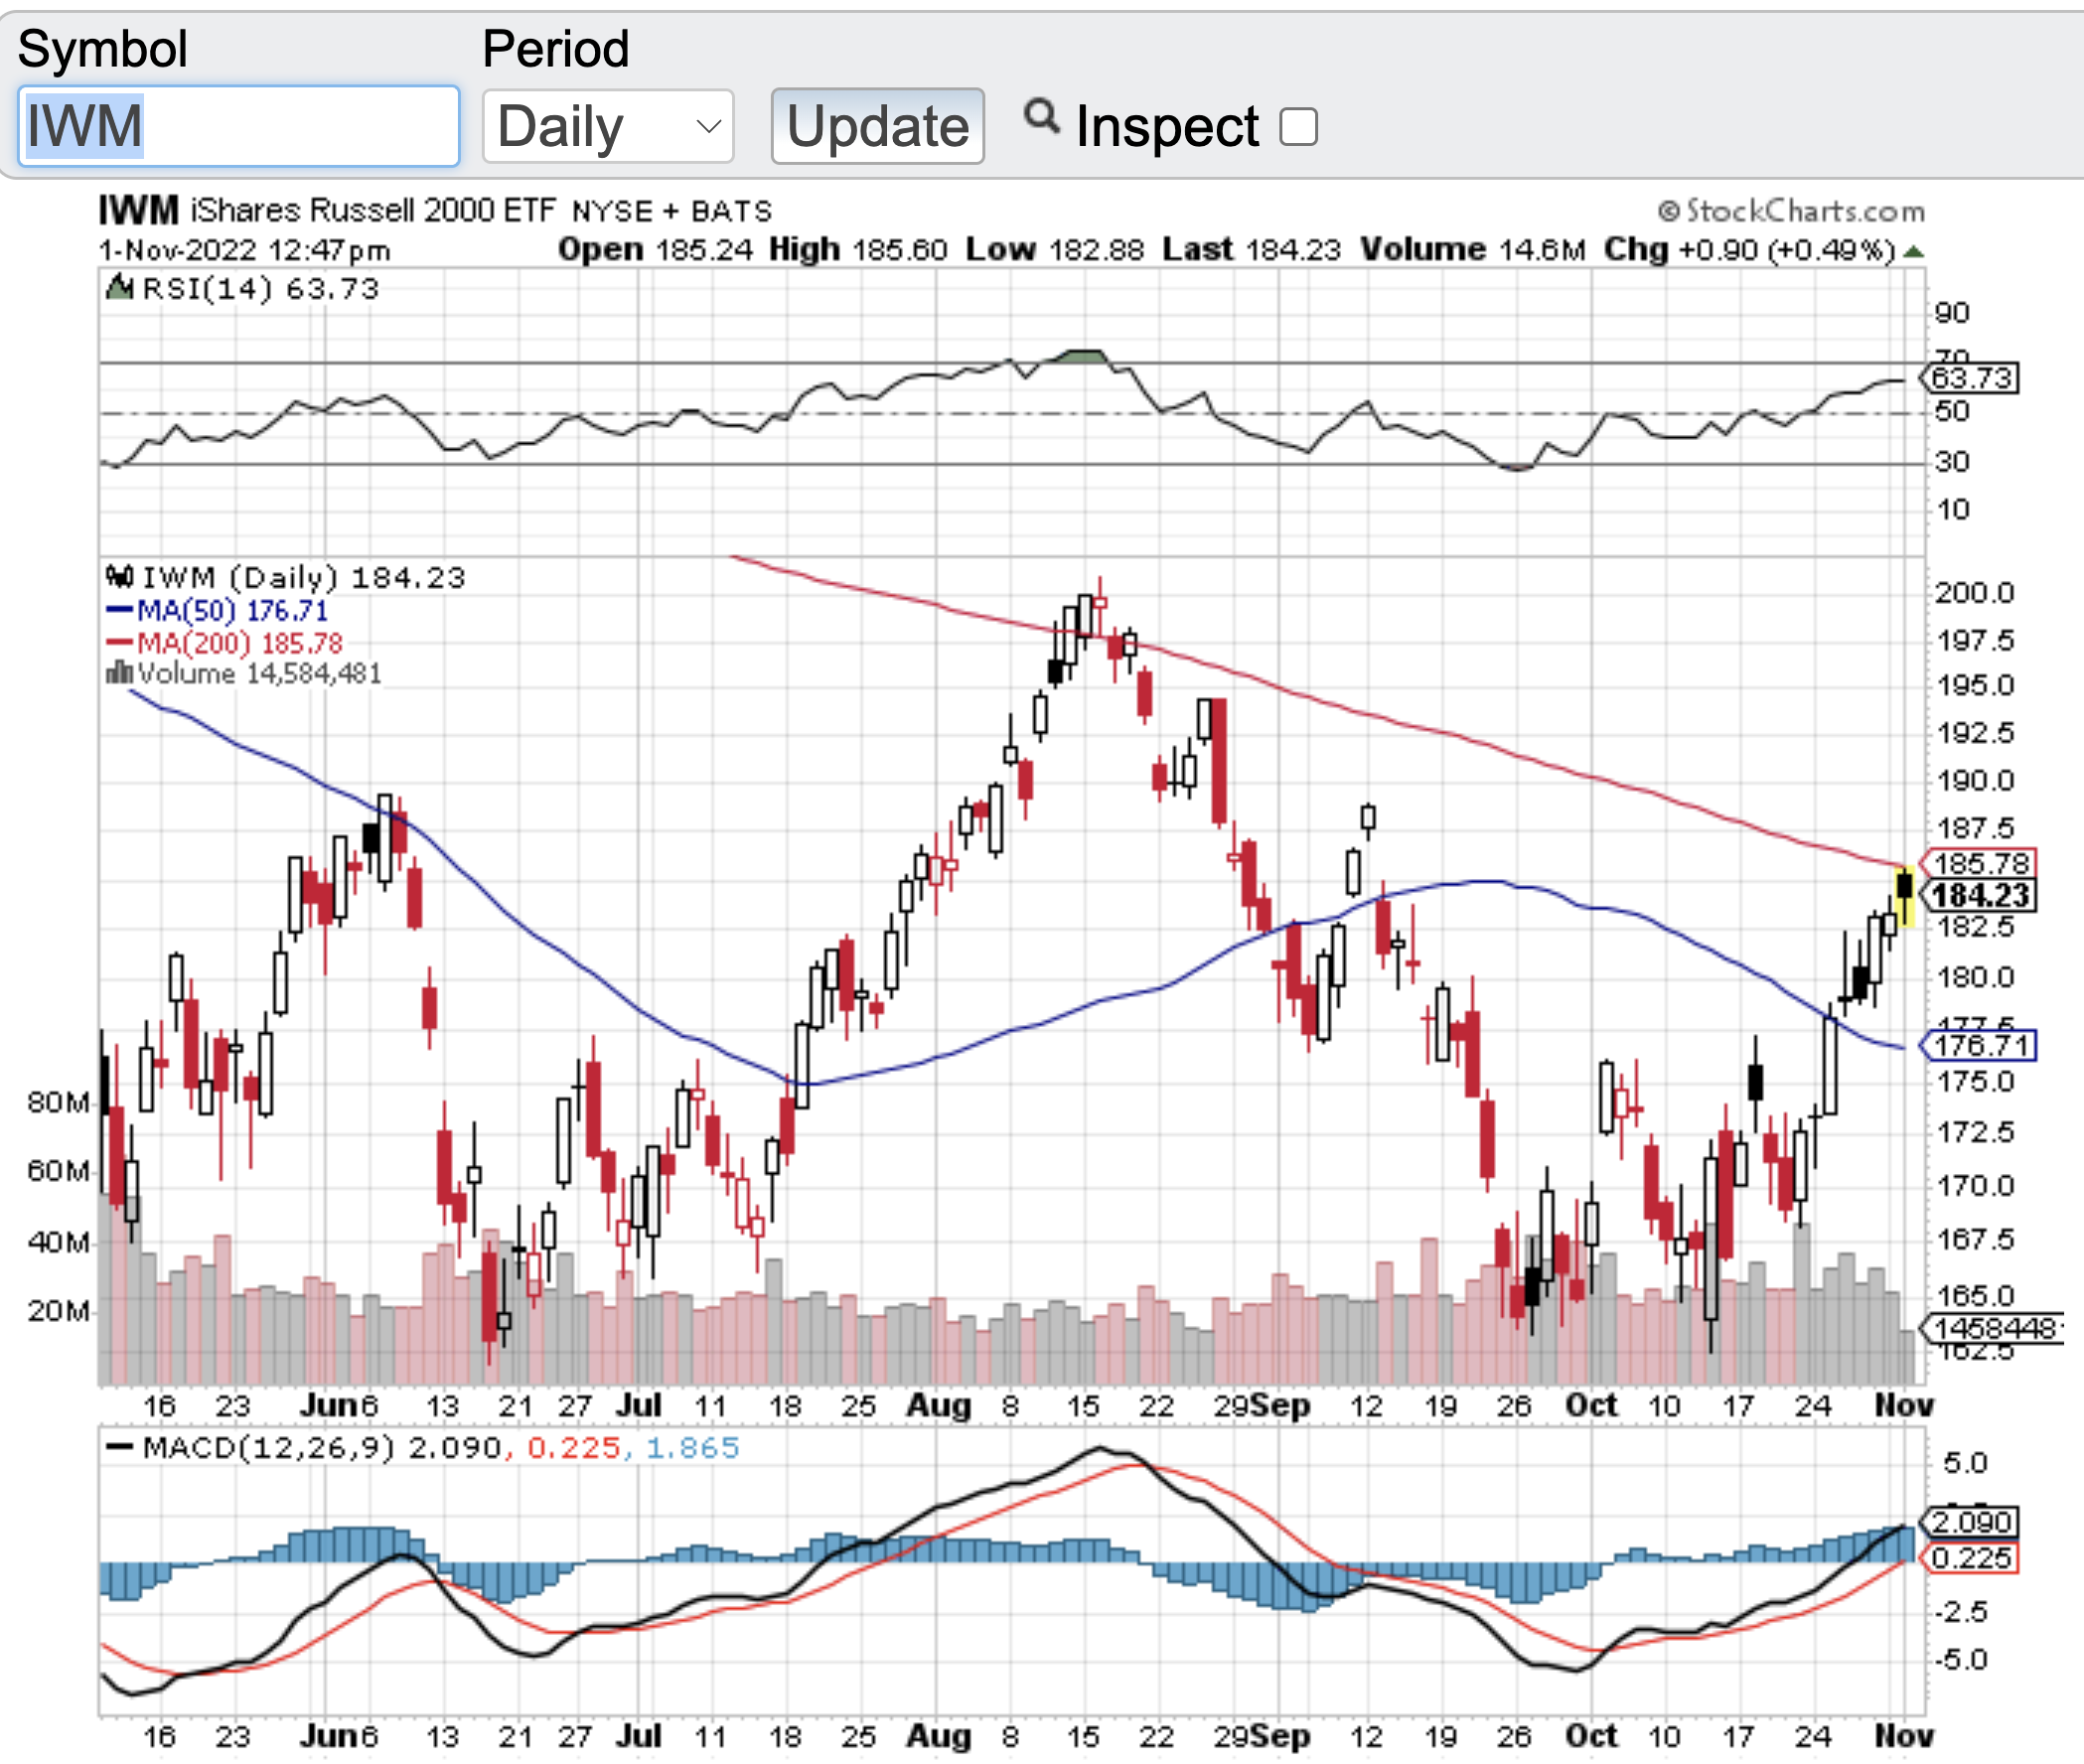
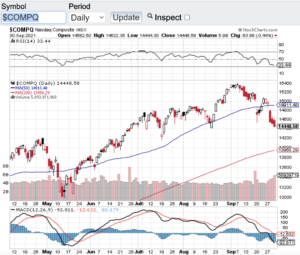
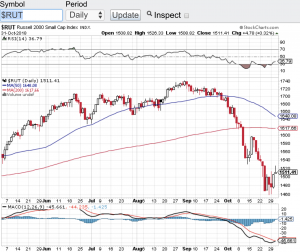
We just witnessed the best monthly performance for stocks in the Dow in decades. The Dow Jones Industrial Average (see chart here) closed the month of October up almost 14%. The S&P 500 (see chart here) finished the month up 8% while the Nasdaq Composite (see chart here) rose 4% and the small-cap Russell 2000 (see chart here and below) closed the month of October out up over 10%. Quite the performance considering how much pressure the markets have been under over the past several months. The one index that is standing out to me right now is the tech centric Nasdaq. Technology stocks remain under pressure as earnings reporting season for the tech sector has disappointed analysts and investors alike. Earnings out of Facebook, Amazon and Google underscores the pressures that the tech sector is currently facing. My feelings are that we are simply in the midst of coming out of an unsustainable bull market that got out of control and into a more balanced and fair valued market. By no means am I suggesting that the market is now at fair value, but it is certainly adjusting to more reasonable levels.

That being said, the Federal Reserve is not done with raising interest rates and inflation also remains at highs not seen in 40 years. Both factors may continue to put pressure on stocks. In fact, there are analysts coming out and projecting another meaningful leg down for the markets. Whatever the case may be, opportunities do present themselves in bear markets however, patience is also required and scaling in is always a good fundamental approach when entering stocks in this type of market environment.

From a technical analysis standpoint, I do see the aforementioned indexes approaching or at their respective 200 and 100-day moving averages could be a sign of pause in this powerful rally we just experienced or a continuation of the current rally.

Good luck to all 🙂

~George


Healthy Corrective Action – Or Something More?

Are we in a healthy correction or is this something more? The recent market selloff including yesterday’s 500 point drop on the Dow Jones Industrial Average (see chart here) has caught the attention of investors and traders alike. The S&P 500 (see chart here) experienced its toughest month in over a year closing down almost 5%. The Nasdaq Composite (see chart here) was lower by over 5% in the month of September. It is not too surprising that the major averages were weaker to close out the third quarter. Historically, September and October for that matter are usually softer months for stocks.

So back to the question is this healthy corrective action or the beginning of a meaningful drawdown? The answer depends on who you ask or how you are interpreting the Federal Reserve’s updated guidance to the monetary policies that the Fed has in place. It is hard to be bearish here based on where the Federal Reserve currently stands. In one breath we hear that “bond purchases” will start to taper off before year end. Then in another breath, the Fed continues to signal that they are prepared to support our economy in the event we experience another surge in Covid. My feelings are the Fed will not put the brakes on their easy monetary policies until such time that our country is out of this pandemic. One thing is for sure, each upcoming Fed policy meeting and subsequent guidance will be put under a microscope more now than ever.

Let’s take a quick gander at the technical shape of the aforementioned indexes. The Dow Jones Industrial Average (see chart here) closed yesterday just below 34000 with its 200-day moving average currently at 33360. The S&P 500 (see chart here) closed yesterday at 4307 while also breaching and closing below its 100-day moving average. The Nasdaq Composite (see chart below) closed the month of September at 14448 also breaching its 100-day moving average. So the current technical set up could mean more downside ahead, but on the other hand, if these moving averages hold and acts as support, we could see a strong relief rally.

Good luck to all 🙂

~George

Healthy Corrective Action - Or Something More? - Paula Mahfouz


A Long Overdue Correction!

It was a spooky time for the equity markets in October as stocks experienced a long overdue correction. You have to go back seven years to have a month that sold off in the way the markets behaved in October. Yes, historically October has been one of the most volatile months of the year. The problem with historical data over the past several years is most of the time history has NOT repeated itself. Stocks have been on a tear for years breaking record after record. In fact not that long ago all of the major indexes had set all time record highs. Fast forward to today and we find the Dow Jones Industrial Average (chart) down almost 7% from its recent all-time high, the S&P 500 (chart) actually fell at one point over 10% from its all-time high finishing the month of October down 8%, the Nasdaq Composite (chart)  is down over 10% from its recent all-time high and the small-cap Russell 2000 (see chart below) is off over 13% from its all-time high recorded on August 31st of this year. So I think it is safe to say most of the market is in correction mode.

Next question, is this a healthy correction for the markets and will stocks find their bottom here or could this be the start of our first bear market in a decade? I guess the answer depends upon who you ask. I think it is too early to call out that a bear market is in the making, but one thing is for sure, we have not seen sustained volatility as we have witnessed recently in a very long time. As long as the trade war rhetoric continues to spew out of Washington and as long as the Federal Reserve keeps its foot on the gas pertaining to interest rates, I think the wild swings and volatility will continue. Oh yea, there is also this small event next week called the “mid-term elections” which should also play a key role in continuing vol. Good luck to all 🙂

~George

Russell 2000 - Paula Mahfouz

Is It A Looming Rate Hike, Or Something Else?

After posting blistering gains in the month of October, stocks took it on the chin last week and it’s technically looking like more short-term downside could be in the cards. For the week, the Dow Jones Industrial Average (chart) lost 665 points, the Nasdaq (chart) retraced 219 points or 4.3%, the S&P 500 (chart) -76 points and the small-cap Russell 2000 (chart) closed lower on the week by 53 points or 4.4%.

Seemingly, the start of the selling pressure accelerated when the October labor report came out surprisingly strong. This report was released on November 6th. One could say that this is the main reason stocks have been under pressure. Pundits are now calling with almost certainty that the Federal Reserve has the green light to raise interest rates at their next meeting in December. Couple this will commodity prices continuing to fall, in particular oil, which is down recently almost 10% and you can understand why the markets would be under pressure. Or could it be the simple fact that October saw almost 10% gains across the board and the key indices were overdue for a pullback. I’d like to add to the mix that the latest round of economic numbers could also be weighing in on investor sentiment. This is evidenced by a weaker than expected retail sales number and weak retail earnings reports issued last week along with a very weak Producer Price Index. Sum all of this up and it’s no wonder the aforementioned indexes closed lower by almost five percent last week. From a technical perspective the key indexes have now breached their respective 200-day moving averages and if you are bullish, you would want to see the markets recapture this key technical support line and return to the uptrend that was intact throughout the month of October.

As the Thanksgiving Day holiday fast approaches, both Paula and I wish everyone a very safe, healthy and Happy Thanksgiving 🙂

~George