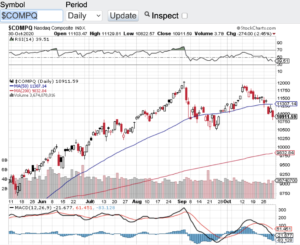
All Time High For The Dow!
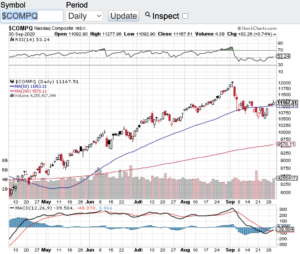
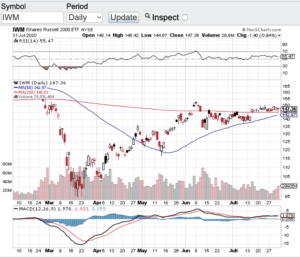
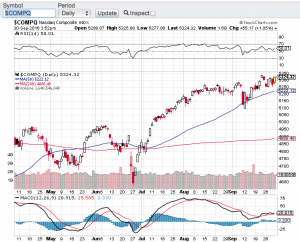
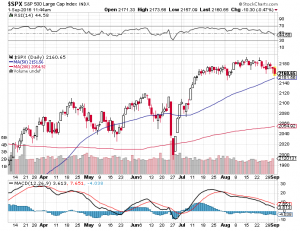
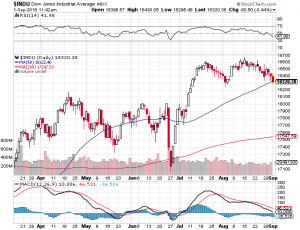
Yet another all-time high was set for the Dow Jones Industrial Average! (see chart here and below). Stocks continuing their winning ways especially for the Dow Jones Industrial Average which closed out the month of August at 41,563 setting a fresh record high. The S&P 500 (see chart here) is flirting with a new high as well, however, both the Nasdaq Composite (see chart here) and the small-cap Russell 2000 (see chart here) are playing catch up.
For some the stock market performance here in 2024 is a head scratcher. Pundits are asking why is the stock market continuing to outperform despite the headwinds our country faces? The immediate knee jerk response to that question is seemingly easy to answer; inflation is cooling, and the Federal Reserve is signaling rate cuts. I am not so sure it is that easy of an answer. Sure, inflation is indeed adjusting down and the Fed seems to be ready to cut rates, however, I would also have to add in that the calendar is also playing a role. Historically, election years tend to positive years for stocks, this along with the Fed seemingly ready to cut rates is a set-up for market outperformance, hence all-time highs have been plentiful throughout this calendar year. That being said, I would not be surprised to see volatility pick right back up as we head into September. Historically, September is a tough month for stocks, (click here). Pundits call it the September effect which basically is an historical average over the past 100 years on how the market performs in the month of September and that metric demonstrates a consistent downward trend in this given month. Now past performance does not guarantee future results, but this is something I will pay attention to.
Whatever the case is, we are now heading straight into year end with a Presidential Election to boot. I do expect a lot of action and volatility straight ahead. Good luck to all 🙂
~George