Strong Earnings Results Buoy Stocks!

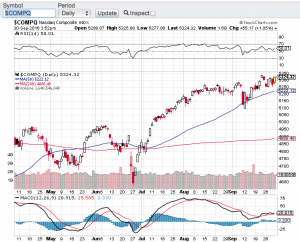
Q1 strong earnings results buoy stocks! Corporate profits for this past quarter have exceeded expectations. On average corporate earnings growth surpassed 20 percent for the quarter however, it appears that the markets have priced in this impressive growth. For the most part stocks have had a muted response to their earnings results so far this year. The S&P 500 (chart) is barely up on the year. The Dow Jones Industrial Average (chart) finds itself essentially flat with the Nasdaq Composite modestly up (chart), however, the small-cap Russell 2000 (chart) quietly hit an all time high today. Interestingly enough when small-cap stocks are outperforming the other bellwether indexes, it’s usually a good sign for a rest of the market. We will have to see if history repeats itself here.

Yes the markets as a whole may not be up that much this year, but I am impressed with how the overall landscape has held up. The pending trade war with China, the on again and off again tensions with North Korea and rising interest rates have yet to really take hold of these markets in a negative manner. Yes we did experience a 10% sell-off in February but only to be met with support and a resumption of the upward bias towards stocks. That said, I do feel the markets are teetering on the potential of another pullback. Let’s take a look at the technical shape of the aforementioned indexes.

The Dow Jones Industrial Average (chart) closed just under its 100-day moving average at 24714, S&P 500 (chart) is on the other side of that coin closing just above its 100-day moving average at 2720, the Nasdaq Composite (chart) closed at 7382 and as previously mentioned, the small-cap Russell 2000 (chart) notched an all time high today breaking out of a triple top closing at 1625. So technically speaking these key indexes are not in any type of extreme condition either overbought or oversold and we will have to see how the balance of earnings reporting season plays out and whether or not we break out to the upside or have another retracement. Good luck to all 🙂

~George

Uncertain Times And Near Record Highs!

Despite the uncertain times we find ourselves in vis-à-vis the upcoming presidential election, the Deutsche Bank balance sheet and liquidity concerns and the upcoming third quarter reporting season, stocks continue to defy the odds and remain within striking distance of all-time highs. The Dow Jones Industrial Average (chart) closed the third quarter at 18308, the tech-focused Nasdaq (see chart below) closed at 5312, the broad based S&P 500 (chart) finished the quarter at 2168 and the small-cap Russell 2000 (chart) closed at 1251.

I am truly amazed how strong the markets have been all things considered. We did see volatility spike in September which was no surprise. However, what was surprising is how short lived it was especially with how much concern and risk there is out of Europe and in particular Deutsche Bank. A couple of weeks ago the U.S. Department of Justice announced they were seeking a $14 billion dollar fine to settle Deutsche Bank’s mortgage lending activities during the 2008 housing crisis. Shares of Deutsche Bank stock plummeted on the news and raised concerns about the solvency of the bank. Stocks did react to the news but have seemingly shrugged off this potential risk to the markets. Furthermore, stocks so far have also shrugged off the uncertainty due to the upcoming presidential election. Monday’s presidential debate sparked controversy as to who won it, but it is clear that the markets saw that Hillary Clinton won the first round.

As we now enter the month of October, without question the headlines and chatter will only increase as we get closer to election day which is November 8th. I am expecting volatility to not only increase but to last longer than usual due to the amount of news flow that is forthcoming which includes the launch third quarter earnings reporting season. What I do in this type of market environment is tune out the noise and stay focused on the fundamentals and technicals of select stocks and indexes. I seek out and identify market dislocations including overbought and oversold conditions. My assumption is that as we get in the thick of third quarter earnings reporting season, overbought and for that matter oversold opportunities will present themselves. Good luck to all 🙂

~George


nasdaq chart george mahfouz jr

As Promised, Vol Is Back!

We knew it was only a matter of time. After trading in the most narrow range for the better part of the summer the VIX (see chart below) which is the ticker for the Chicago Board Options Exchange Volatility Index spiked this week over 60%!  This on fears that monetary policy changes are forthcoming here in the United States and abroad, especially as it pertains to interest rates. How is this a surprise though? There is not a day that goes by, in fact there is not an hour that goes by without headlines coming out pertaining to the Federal Reserve and what they will or will not do with interest rates.

Look my view is simple, count on it! Count on central banks changing their position on interest rates at some point in time. What amazes me is how much the markets and investors have become so reliant and seemingly make every investment decision based on whether interest rates remain near zero or begin to rise. How about this concept? Take a look at the premiums the markets have enjoyed over the past several years and minus that out. Then in my humble opinion we get back to fair value in stocks and markets. Although this has been one of the most profound bull markets in history, at some point in time equities are going to have to get off of the dependence on central bank accommodations. I look for ward to the day that we will be able to properly evaluate stocks and asset classes based on their respective fundamentals not on Federal Reserve policies.

Until then, the bulls can continue to enjoy the ride they have been on and I will continue to pay close attention to overbought and oversold conditions. With volatility back, this does create opportunity for the trader that is not too concerned with valuations. However, I expect that in the not so distant future, valuations will actually matter again. Good luck to all 🙂

~George

VIX chart George Mahfouz Jr

Late April Sell-Off Wakes Up The Bears…

Stocks sold off sharply on the last trading day of April. The Dow Jones Industrial Average (chart) fell 195 points, the Nasdaq (chart) closed down 82.22 points, the S&P 500 (chart) lost 21.34 points and the small-cap Russell 2000 (chart) finished lower by 26.83 points. The biotech sector has lead the charge in this most recent selloff with the most popular biotech ETF (Symbol: IBB) (chart) losing over 10 percent of its value since mid-March. Another factor in this sell-off is the sloppy earnings reporting season we find ourselves in. Just this week both Twitter (NYSE: TWTR) and Linkedin (NYSE: LNKD) surprised the street with their weak quarterly results and even weaker forward guidance. So the selling pressure is not just in the biotech space, it has now spilt over to the technology sector as a whole. That said, this morning there may be a bit of a respite with the futures market pointing up sharply.

Let’s take a look at the technical shape of the markets as we now enter into May. One troubling sign is the four major averages mentioned above have all breached their 50-day moving average line, with the small-cap Russell 2000 falling prominently below it. Let’s see if these key indices remain below this popular technical indicator for more than a few days. A one day breach does not necessarily mean a total technical breakdown however, another slight concern of mine is that these averages are not oversold yet according to the relative strength index or the RSI. Click here for the definition of the RSI. Now take a look at the charts of the Dow (chart), Nasdaq (chart), S&P 500 (chart) and the Russell 2000 (chart) and you will see at the very top of the chart the plot of the relative strength index and you will further see that these indexes have more room to go to reach the 30 value level of the RSI, which is the level that qualifies an oversold condition. Now throw into the mix that May is historically a weak month for equities and we indeed be in for some additional selling pressure.

In closing, I will re-visit the technical make-up of the markets in mid-May and see where there could be some buying opportunities. Good luck to all 🙂

~George

No Bubble Here…

At least according to Janet Yellen as she spoke before the Senate Banking Committee on Thursday. In a prepared speech to the committee, Vice Chair Yellen stated that the U.S. economy continues to improve and that the housing market has turned a corner with construction, home prices and sales up significantly. Ms. Yellen went on to indicate that she supports the Federal Reserve’s monetary policies which continue to purchase bonds and mortgage backed securities. Investors took this cue as a very positive sign going forward and sent the markets yet again to all time highs this past week.

For the week, the Dow Jones Industrial Average (chart) closed up 1.3% and is also closing in on the 16,000 mark, the S&P 500 (chart) gained 1.6%, the Nasdaq (chart) +1.5% and the small-cap Russell 2000 (chart) finished the week up 1.47%. Stocks continue to be on a tear and now it is clear that unless their is some unforeseen negative macro-event that occurs from now until year end, these markets should close the year out with over 20% gains respectively. Now that doesn’t mean that pullbacks or even a modest correction couldn’t occur, but should this be the case, I would assume that any retracement would be met with the “buying the dip” mentally that has gone on all year long.

Now let’s take a look at how the technical conditions are shaping up for the aformentioned key indices. When I consider running a technical analysis on stocks or indexes, the two indicators I favor the most are the Relative Strength Index also know as the RSI and the moving averages. Out of plethora of technical indicators out there, these particular indicators are the most reliable, at least for me. Part of the reason why I favor the RSI and moving averages indicators are that many computerized trading models and certain institutional investors utilize them, which in turn moves the market. Historically, when the Relative Strength Index (RSI) is at an overbought or oversold condition, the majority of the time the asset or index reverts back to the mean. Same rings true with the moving averages, whenever a stock or index rises up against or comes down to its moving average, typically the stock or index finds support or resistance. So in looking at the current state of the Dow (chart), S&P 500 (chart) , Nasdaq (chart) and the Russell 2000 (chart) all of these indexes are indeed approaching overbought territory which according to the RSI definition is the 70 value level, but they are not there yet. Actually, my personal preference is to not only see a breach of the 70 value level but a continuation up into overbought territory before I consider selling into that condition. As it pertains to the moving averages technical indicator, these key indices are all comfortably above their respective 20-day and 50-day averages, with the 200-day moving average no where in sight.

So what does all of this mean? Technically speaking and considering we are heading into year end, there is a high likelihood that markets continue to head north, but I will be paying close attention to the technicals as to when we may see the inevitable pullback.

Good luck to all and have a great weekend 🙂

~George

Technically speaking…

Stocks finished lower for the week as volatility continued to rise. For the week, the  Dow Jones Industrial Average (chart) closed down 1.17%, the Nasdaq (chart) -1.32%, the S&P 500 (chart) -1.01% and the small-cap Russell 2000 (chart) closed the week lower by 0.63%. Is this bull market beginning to show signs of fatigue or is this just a typical pre-summer pullback? Let’s take a look at the technical picture of these key indices and see what’s going on there.

Market technicians use a multitude of indicators to discern potential support or resistance levels. My preference has always been to keep things as simple as possible when analyzing charts of stocks or indices. The two indicators I pay the closet attention to is the Relative Strength Index also know as the RSI and the moving averages. Out of dozens of technical indicators that are available, you may ask why do I prefer these particular indicators? The answer simply is that high profile market technicians,  computerized trading models and certain institutional investors utilize them.  Time and time again when I see that Relative Strength Index (RSI) is indicating an overbought or oversold condition, the majority of the time the asset or index reverts to the mean. Same rings true with the moving averages, whenever a stock or index bumps up against or comes down to its moving average, typically the stock or index finds support or resistance.

Let’s break this down in more detail. Pertaining to the (RSI), The RSI is designed to demonstrate whether or not an index or equity is overbought or oversold, depending on certain value levels. According to the RSI principle, the 70 value level or greater, is an overbought condition and the 30 value and below is an oversold condition. As of right now the aforementioned indices are hovering around the 50 value level which is not indicating an extreme condition either way. Looking at the moving averages these indices remain above their 50-day moving average and as you can see with the Dow Jones Industrial Average (chart) and S&P 500 (chart), these indexes have bounced off their 50-day moving averages/support lines three times over the past week or so which clearly demonstrates the potential of the power and precision of this particular technical indicator.

So technically speaking, I see nothing that would indicate an extreme condition of these indexes and as long as their are no major surprises out of the FOMC meeting next week, we should see smooth sailing heading into the summer. Good luck to all.

Have a great weekend 🙂

~George

Let’s talk technicals…

As certain stocks and markets continue to unexpectedly plow to new 52 week highs, I think it’s time to look at the technical aspect of the indexes. For the week, the Dow Jones Industrial Average (chart) finished up 0.51%, the Nasdaq (chart) +1.84%, the S&P 500 (chart) +0.87% and the Russell 2000 (chart) +2.29%. I do not remember a time when equities have behaved this well in the month of August, albeit on very low volume.

Now to the technicals. I typically refer to two of the more popular technical indicators that certain market technicians, program trading models and even institutional investors utilize, and they are, the Relative Strength Index (RSI) and the Moving Averages technical indicators. The RSI is designed to demonstrate whether or not an index or equity is overbought or oversold, depending on certain value levels. According to the RSI principle, the 70 value level or greater, is an overbought condition and the 30 value and below is an oversold condition. Pertaining to the moving averages, the 50-day and the more closely monitored 200-day moving averageare the key markers that market technicians and program trading models look for and potentially act on.

In looking at the four major averages, they are all currently trading considerably above their respective 50-day and 200-day moving averages. However, both the Nasdaq (chart) and the S&P 500 (chart) is on the cusp of breaking through the 70 value level on the RSI. Furthermore, the Dow Jones Industrial Average (chart) and the Russell 2000 (chart) are not too far behind trading around the 65 value level. This is an indication that the markets are potentially becoming overbought and are due for some type of pullback. Please keep in mind that stocks can remain overbought or oversold for extended periods of time. That said, when the RSI on a given equity or index begins to trade at or above this key level, a reversal of some sort typically occurs. Now there are many other factors and technical indicators to refer to when analyzing market conditions, but my preference is to keep it simple when looking at the technicals, and the RSI and moving averages indicators do it for me. Good luck to all.

Have a great weekend 🙂

~George


A week of respite for stocks…

Despite the Dow, Nasdaq, S&P 500 and the Russell all finishing lower on Friday, these key indices finally completed a week in positive territory. In fact, this is the first positive week for the bellwether indexes in the month of May. For the week, the Dow Jones Industrial Average (chart) closed up 0.69%, the Nasdaq (chart) +2.11%, the S&P 500 (chart) +1.74% and the Russell 2000 (chart) gained 2.57%.

Without question the markets last Monday experienced a technical bounce due to oversold conditions across the board. What was impressive to me is that equities for the most part managed to hold on to their gains. Not so sure if this will be the case this upcoming week. Between the never ending saga from across the pond and a slew of economic reports from here at home, next week is setting up to be to be a very volatile week. The most critical economic report that all will be watching is Friday’s jobs report. If we do not begin to see the private sector strengthen in a meaningful way, we could be in for a long summer and a possible new administration this fall. Good luck to all.

Have a safe and healthy Memorial Day weekend 🙂

~George