Risk On Remains On!

Risk on in the markets remains on as we approach the second half of the year! It’s truly remarkable to me how stocks, crypto, real estate and other asset classes are still trading at or near all time highs. I do get that the ongoing accommodative policies provided by our Federal Reserve and from central banks across the globe is the main reason why asset prices continue their bullish ways.

That said, I do think it is time to start considering how things could look once the Federal Reserve in our country starts backing away from its accommodative monetary policies and as interest rates begin to normalize. This is not a question of if, it’s a question of when. Tell tale signs of inflation are now seemingly everywhere which is what the Federal Reserve is paying close attention to and could be the catalyst for the Fed to act. It is at this point our markets could be adjusting to align with real interest rates and normalized price to earning multiples. To that end, we have and continue to witness the most unique market conditions ever seen. So I am not calling a top here and I do respect the power of the Federal Reserve, however, I am just suggesting that we may see a healthy and overdue adjustment in asset prices which may not be such a bad thing. There are many investors that are on the sidelines and would be more than happy to step in should we see asset prices adjust to a lower entry point.

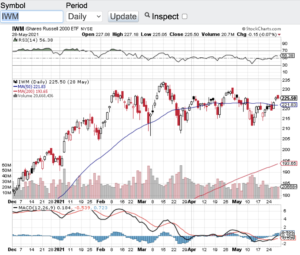
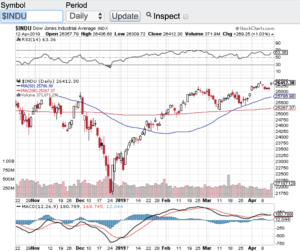
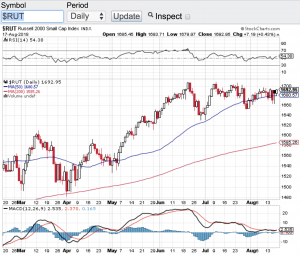
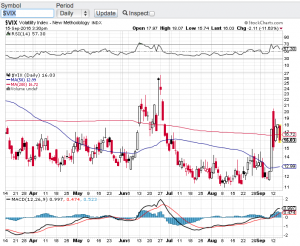
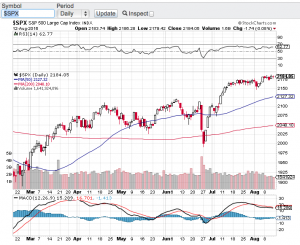
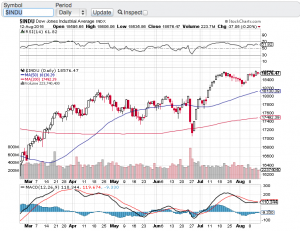
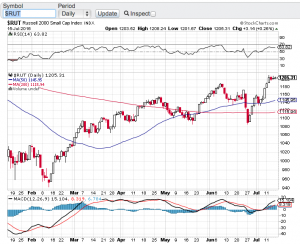
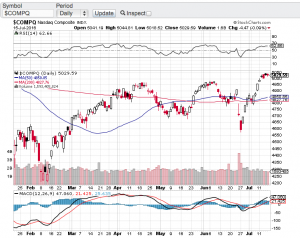
Let’s take a quick look at the technical shape of the major averages. The Dow Jones Industrial Average (see chart here), the S&P 500 (see chart here), the Nasdaq Composite (see chart here) and the Small Cap Russell 2000 (see chart below) all are trading above their 20, 100 and 200 day moving averages. This alone is a strong technical backdrop and what’s more is none of the aforementioned indexes are currently overbought according to the relative strength index aka the RSI. So technically speaking things look pretty good right now.

Good luck to all 🙂

~George

Risk On Remains On - Paula Mahfouz


Will Earnings Take The S&P To All Time Highs?

Now that earnings reporting season is upon us, will Q1 corporate earnings take the S&P 500 (see chart here) to all time highs? We are about to find out. For the first time in months the S&P 500 (see chart here) closed above the 2900 mark and is now within striking distance of its record close of 2940 set back in September. Once again the markets feel like they are in melt up mode. The Dow Jones Industrial Average (see chart below) closed on Friday at 26412 just 500 points away from its record high, the Nasdaq Composite (see chart here) is approaching the 8000 level a level it hasn’t seen in months, and last but not least the small-cap Russell 2000 (see chart here) is approaching the 1600 level and trading above its 200-day moving average.

The technical shape of the markets also appear to be healthy heading into Q1 earnings reporting season. All of the aforementioned indexes are trading above their 20-day, 100-day and 200-day moving averages. A good sign. Furthermore, none of these averages are in overbought territory this according the the relative strength index. Yet, another good sign.

Back to Q1 earnings reporting season. Although analysts and market pundits expect corporate earnings to have declined this quarter, I will be paying attention to the guidance that companies give. It’s no secret there has bee a global slowdown lately due to a variety of factors. However, if companies give better than expected guidance, then most likely we should indeed see new record highs.

Companies to look out for this week that are reporting are, Citigroup (NYSE: C), Goldman Sachs (NYSE: GS), Bank of America (NYSE: BAC), Johnson & Johnson (NYSE: JNJ), Netflix (NasdaqGS: NFLX), United Continental Holdings (NasdaqGS: UAL), Abbott Labs (NYSE: ABT), Alcoa (NYSE:AA), Las Vegas Sands, Corp. (NYSE: LVS), PepsiCo, Inc. (NasdaqGS: PEP), American Express (NYSE: AXP) and Honeywell International (NYSE: HON) just to name a few. Let’s see if Q1 earnings reporting season becomes the catalyst for new record highs. Good luck to all 🙂

~George

Dow Jones Industrial Average - Paula Mahfouz


Trading Between The Lines…

Trading between the lines is how this August is playing out so far. In what is supposed to be a seasonal volatile period, August seemingly has been playing right to the tune of this almost decade long bull market. The Dow Jones Industrial Average (chart), the S&P 500 (chart), the Nasdaq Composite (see chart) and the small-cap Russell 2000 (see chart below) to my surprise have all traded in a tight range this month. Furthermore, the 20-day moving average and even more so the 50-day moving average have played a major role in supporting the indexes whenever any selling does come in. Now we have had a couple days here in August where it looked like these support lines would be breached and in fact in some instances they were. However, whenever these support lines were touched or breached, buying came right in and placed a floor beneath the selling pressure.

I am not sure how the rest of the month will play out but August at least from a seasonality perspective still has the potential to demonstrate volatility and experience meaningful selling pressure. I really do believe that the bear camp expected to see August as their month, but from the looks of things the bears may have to wait until September or beyond. Corporate earnings for the most part have been topping expectations, the economy is seemingly firing on all cylinders and rising interest rates are not that big of a factor yet to be weighing heavily on stocks.

My plan for the rest of the month is simple. Pay attention to the support and resistance zones of the aforementioned indexes and for that matter any stock that I am considering to trade. Secondly, I need to see the trading volume pick up before any definitive trend can be trusted. The market volume just has not been here this month which is also typical of the dog days of summer. Patience is the keyword between now and month end. That said, I expect after the labor day holiday we will be having a much different conversation. Good luck to all 🙂

~George

Russell 2000 - Paula Mahfouz

Simply On Fire!

Stocks continue to set records and now on a daily basis! As I am writing this blog the Dow Jones Industrial Average (chart) is now trading north of 20440, the S&P 500 (chart) is trading well above 2300, the Nasdaq (chart) is trading above 5750 and the small-cap Russell 2000 (chart) set an all time high yesterday at 1398! I continue to be amazed on how resilient the markets have been and continue to be. Earlier this month it appeared that the Trump rally stalled out and it was becoming a wait and see environment. Well now the Trump rally has seemingly reignited. Trump last week announced he has major news forthcoming on his tax plan and that was apparently the cue for the markets to rally yet again. However, one has to ask how many more tweets, news conferences or headlines can take the markets higher? Without question the above key indices are becoming overbought and especially pertaining to the relative strength index also know as the RSI. Let’s take a look.

Currently the Dow Jones Industrial Average’s RSI (chart) is trading at a 73, the S&P 500 (chart) RSI is also currently at 73, the Nasdaq (chart) is even higher at 77. The only laggard pertaining to the relative strength index and being in an “overbought” condition is small-cap Russell 2000 (chart) in which its RSI is currently at the 60 value level. Remember the relative strength index is a widely utilized technical indicator that certain institutional traders include in their models along with a variety of algorithm trading platforms. The RSI is a momentum indicator that tracks the size of gains and losses over a given period of time with the 70 value level and above as overbought and the 30 value level and below as oversold. One of the concerns certain market technicians have is that these all time highs and overbought conditions have been occurring on relatively light volume. Without trying to call a top here, I suspect that the aforementioned indices and some of the overbought stocks within these indexes are due for a pullback.

Good luck to all and Paula and I wish everyone a Happy Valentine’s Day 🙂

~George


Quietly The VIX Elevates…

Over the past week the CBOE Market Volatility Index aka the VIX (see chart below) has risen over 35%. Not too surprising considering the upcoming elections and the daily rhetoric that has been hitting the wires. What is surprising to me is that even though volatility has spiked recently, the markets have not really dropped. Isn’t how this is supposed to work? Increase in vol equals lower stock prices? The Dow Jones Industrial Average (chart), the S&P 500 (chart) and the Nasdaq (chart) all remain within striking distance of all-time highs and so far these key indices do not seem to be too bothered by the daily political headlines. Even Friday’s surprising if not shocking news that F.B.I. director James Comey has re-opened the Hillary Clinton email case could not rattle the markets. Although this particular headline did send stocks sharply lower in the late afternoon trading on Friday only to find support and close off of the lows.

I will say this; I am even more surprised that yesterday we did not see a sell-off in stocks after everyone had time to digest the news over the weekend. Stock market pundits continue to claim that the markets have priced in a Clinton victory and that her taking the White House in general will be bullish for stocks. I tend to agree with this however; my concern is will this be a “sell the news” event? I will also be paying closer attention to the polls this week to see if the Trump campaign closes in on the Clinton lead. This too can be a market moving dynamic. So as the VIX continues to lift and as we get closer to November 8th, I will error on the side of caution and lighten up any long positions and wait to see how this election plays out. Let’s also see how the markets react and respond to the election results and then come up with a game plan into year-end. Good luck to all 🙂

~George

VIX chart George Mahfouz Jr

As Promised, Vol Is Back!

We knew it was only a matter of time. After trading in the most narrow range for the better part of the summer the VIX (see chart below) which is the ticker for the Chicago Board Options Exchange Volatility Index spiked this week over 60%!  This on fears that monetary policy changes are forthcoming here in the United States and abroad, especially as it pertains to interest rates. How is this a surprise though? There is not a day that goes by, in fact there is not an hour that goes by without headlines coming out pertaining to the Federal Reserve and what they will or will not do with interest rates.

Look my view is simple, count on it! Count on central banks changing their position on interest rates at some point in time. What amazes me is how much the markets and investors have become so reliant and seemingly make every investment decision based on whether interest rates remain near zero or begin to rise. How about this concept? Take a look at the premiums the markets have enjoyed over the past several years and minus that out. Then in my humble opinion we get back to fair value in stocks and markets. Although this has been one of the most profound bull markets in history, at some point in time equities are going to have to get off of the dependence on central bank accommodations. I look for ward to the day that we will be able to properly evaluate stocks and asset classes based on their respective fundamentals not on Federal Reserve policies.

Until then, the bulls can continue to enjoy the ride they have been on and I will continue to pay close attention to overbought and oversold conditions. With volatility back, this does create opportunity for the trader that is not too concerned with valuations. However, I expect that in the not so distant future, valuations will actually matter again. Good luck to all 🙂

~George

VIX chart George Mahfouz Jr

What August Swoon?

Actually quite the contrary! In fact new all time highs occurred this past week with the S&P 500 (see chart below), the Dow Jones Industrial Average (see chart below) and the Nasdaq (chart, click here). What’s more is these record closing highs of the aforementioned indexes occurred on the same day last week, a feat that has not happened since the bubble of 2000. Now I am not suggesting we are in a bubble like we were in dot-com days. Back then valuations of dot-com stocks and most of technology were rather insane. That said, the current price to earnings ratio of the S&P 500 is in the 20’s which is historically high. That alone could be a catalyst for a pause and consolidation and/or a pullback from the record high territory we have been trading in.

I am almost frightened to think or suggest that a retracement of any type is forthcoming simply due to the way the markets have been trading in a typically weak market season. As mentioned in my previous blog, August tends to be one of the weakest months of the year for the stock market. There is still a couple of weeks left in August and it is not too late to see historic trends surface. However, the way stocks have traded lately and with no real economic or geopolitical catalysts in the foreseeable future, this market melt-up may indeed continue.

Technically speaking, the trend lines of the 20-day, 50-day and 200-day moving averages all remain in tact and are yielding upward and the relative strength index of the key averages are not officially in overbought territory. So this is enough for me to not really expect much out of the market in either direction as we head into Labor Day weekend and as the summer winds down. Good luck to all 🙂

~George

S&P chart george mahfouz jr

dow jones chart george mahfouz jr

Record Setting Week!

A three-week stock market winning streak has propelled the Dow Jones Industrial Average (chart) and the S&P 500 (chart) to close at record highs. In one of the most dramatic turn of events from the shocking Brexit vote to today, these key indices were breaking records all week long. The Nasdaq (see chart below) and the small-cap Russell 2000 (see chart below) also posted a strong week of gains.

I stand corrected! In my previous blog I referred to the fact that the S&P 500 (chart) had been stuck in a trading range and that upcoming earnings reporting season should act as the catalyst to break stocks out of this range. Furthermore, my view was that corporate earnings most likely would underperform hence a breakdown out of this trading would be more probable. Well here we are today at record highs and we haven’t even gotten into the bulk of earnings reporting season. The largest U.S. bank J.P. Morgan (NYSE: JPM) did however report their results this past week posting a profit of $6.2B. J.P. Morgan’s results came in stronger than expected which also helped fuel this week’s rally, especially in the banking sector.

As much as we were oversold leading up to and just after the Brexit vote, the markets now find themselves approaching overbought territory. Now the question becomes what to do next? As mentioned above, we are full steam ahead into the bulk of earnings reporting season which can come with plenty of surprises. From a technical standpoint I find it hard to commit any new capital into a market at record highs and do so with most of corporate America yet to report their results. I will be paying attention to the top-line growth of companies to get more of an accurate read how their business is fairing compared to their bottom line which can be adjusted in many ways that may not tell the whole story. My concern now is how can record highs continue if top-line growth is not there in a meaningful way? Let’s look to next week to see if the record setting trend continues, or a pause and reversal comes forward.

Good luck to all 🙂

~George

George Mahfouz Jr. Russell 2000 chart

george mahfouz jr Nasdaq chart

Are Stocks Poised To Breakout?

After an early November sell-off, the major averages could be on the verge of a breakout, at least from a technical point of view. The noticeable dip in equities that occurred recently was met with strong support and now stocks have rallied up to key resistance levels. The Dow Jones Industrial Average (chart) closed the month of November at 17720, the Nasdaq (chart) closed at 5109, the S&P 500 (chart) closed at 2075 and the small-cap Russell 2000 (chart) closed the month of November at 1198. As you can see by their charts the three top indices have resistance levels of 18,000, 5175 and 2125 respectively while the small-cap Russell 2000 (chart) is seemingly on the verge of breaking out. That said, it takes more than a day or two trading above a resistance level with strong volume to confirm a breakout. What could be in favor for a breakout with all of the aforementioned indexes is the seasonality of the markets a.k.a. the Santa Clause rally. This could very well be the catalyst for a year-end rally.

What could get in the way of a potential Santa Clause rally? One example could be if the technical resistance line(s) holds true to form and the key indices cannot breakout with conviction above these marks . There is also the risk of China’s market continuing to abate as regulators are cracking down on trading practices of major Chinese brokerage firms. The China weakness can spill over here to our shores even if it is only a short-term consequence. Of course there is always a geo-political risk that could weigh in on market sentiment and behavior. And last but not least, the Good Ole Federal Reserve and whether or not they would implement their first rate hike in almost a decade when they meet later this month.

That said and notwithstanding any of these risks, we have seen stocks incredibly resilient during this multi-year bull run and I would not be surprised if we indeed breakout and experience a year-end rally that could challenge the all time highs. Good luck to all 🙂

~George

Strong Month For Stocks!

Much to my surprise and to the surprise of many investors and traders alike, the major averages in October posted eye-popping results. For the month, the Dow Jones Industrial Average (chart) gained 8.7%, the tech-f0cused Nasdaq (chart) gained almost 10%, the S&P 500 (chart) notched an 8.3% gain and the small-cap Russell 2000 (chart) closed the month out up 5.55%. Yes almost double digit gains for the Dow, Nasdaq and the S&P 500. Now wait a minute, I thought the month of October is supposed to be one of the weakest months of the year for equities. I think in large part earnings reporting season has been a pleasant surprise to most investors and a continuing subdued Federal Reserve is responsible for the most recent gains and confidence in stocks. That said, I do think that this latest market run has been a bit too much too fast.

A quick look at the Relative Strength Index of the aforementioned indexes might also confirm my belief. The relative strength index is also referred to as the RSI. This particular indicator is one of the most watched technical indicators by seasoned traders and investors alike. The RSI compares the size of moves of gains and losses in a given period of time to highlight whether a stock or index is overbought or oversold. According to the RSI principles, the 70 value level or greater is considered an overbought condition and the 30 value level or lower is considered oversold. And as you can see with the Dow Jones Industrial Average (chart), the Nasdaq (chart) and the S&P 500 (chart), all three indexes recently hit or breached their respective 70-value line and reversed course on Friday. Now that does not mean that these indices could not break back through the 70 value level and continue onto higher levels and remain overbought for an extended period of time. What I am saying is that historically and from a technical point of view, the relative strength index has been quite reliable when markets overshoot to the up or down side.

We are now in the final two months of the trading year and let’s see how the markets react to this initial pullback we saw on Friday and whether or not this is the beginning of a slight correction to this extraordinary market run we experienced last month.

Good luck to all 🙂

~George