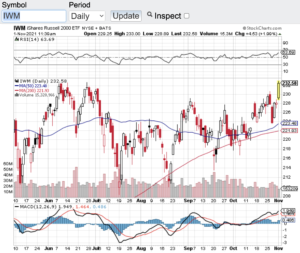
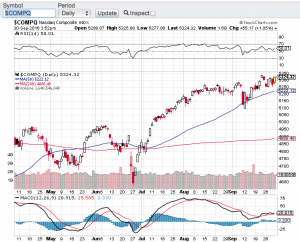
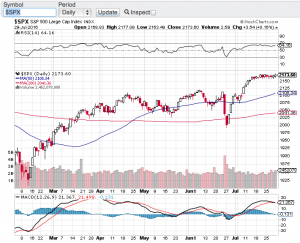
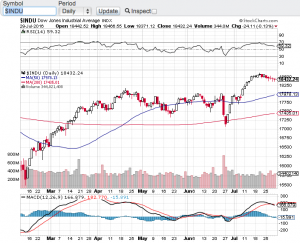
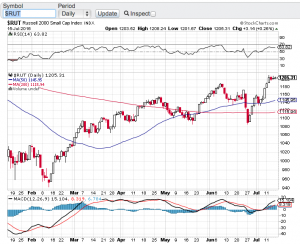
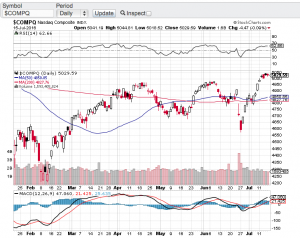
Strong Earnings – Record Highs!

Last month I asked “Is this a healthy correction or something more?” and based on how strong earnings have been along with record highs, I think it is fair to say last months action was more of a healthy pullback than anything else. The Dow Jones Industrial Average (see chart here) is at an all-time high trading above the 36000 mark, the S&P 500 (see chart here) has also hit an all time high today, the Nasdaq Composite (see chart here) has also joined the all-time high club and the small-cap Russell 2000 (see chart here) is within striking distance of its all-time high.

The most recent catalyst for stocks and indexes hitting their all-time highs are earnings. 80 percent of the companies on the S&P 500 that have reported their Q3 earnings so far have beat Wall Street expectations. There are still 1000’s of companies set to report over the coming weeks but if trend continues we could very well be seeing more records set. Along with a strong earnings reporting season no question the Fed continues to encourage all investors to participate due to how low interest rates remain. For most investors there are not many options right now to generate meaningful returns other than the stock market or the high flying crypto space which remains incredibly volatile and extremely risky.

Now let’s take a look at the technical backdrop of the aforementioned indexes. The Dow Jones Industrial Average (see chart here) is trading comfortably above its key moving averages and not quite overbought according to the relative strength index (RSI) and the same can be said for the S&P 500 (see chart here) and the Russell 2000 (see chart below). However, the Nasdaq Composite (see chart here) has just breached the 70 value level of the RSI which is the pure definition of a stock or index becoming overbought. Note, stocks and/or indexes can remain overbought for extended periods of time before a turn.

One of the oldest adages on Wall Street is the trend is your friend and it is clear where the trend has been and where it will most likely go. That said, it is always best to consult with your certified financial planner/advisor if you are considering any portfolio additions, deletions or adjustments.

Good luck to all 🙂

~George

Strong Earnings - Record Highs - Paula Mahfouz

Strong Earnings Results Buoy Stocks!

Q1 strong earnings results buoy stocks! Corporate profits for this past quarter have exceeded expectations. On average corporate earnings growth surpassed 20 percent for the quarter however, it appears that the markets have priced in this impressive growth. For the most part stocks have had a muted response to their earnings results so far this year. The S&P 500 (chart) is barely up on the year. The Dow Jones Industrial Average (chart) finds itself essentially flat with the Nasdaq Composite modestly up (chart), however, the small-cap Russell 2000 (chart) quietly hit an all time high today. Interestingly enough when small-cap stocks are outperforming the other bellwether indexes, it’s usually a good sign for a rest of the market. We will have to see if history repeats itself here.

Yes the markets as a whole may not be up that much this year, but I am impressed with how the overall landscape has held up. The pending trade war with China, the on again and off again tensions with North Korea and rising interest rates have yet to really take hold of these markets in a negative manner. Yes we did experience a 10% sell-off in February but only to be met with support and a resumption of the upward bias towards stocks. That said, I do feel the markets are teetering on the potential of another pullback. Let’s take a look at the technical shape of the aforementioned indexes.

The Dow Jones Industrial Average (chart) closed just under its 100-day moving average at 24714, S&P 500 (chart) is on the other side of that coin closing just above its 100-day moving average at 2720, the Nasdaq Composite (chart) closed at 7382 and as previously mentioned, the small-cap Russell 2000 (chart) notched an all time high today breaking out of a triple top closing at 1625. So technically speaking these key indexes are not in any type of extreme condition either overbought or oversold and we will have to see how the balance of earnings reporting season plays out and whether or not we break out to the upside or have another retracement. Good luck to all 🙂

~George

OPEC Adds Fuel To The Rally!

For the first time since 2008 the Organization of the Petroleum Exporting Countries (OPEC) agreed to cut output sending oil prices and oil stocks soaring. Oil (see chart below) had one of its best days in years soaring over 10% which helped propel the Dow Jones Industrial Average (chart) and the S&P 500 (chart) to set yet another record high yesterday before a late day sell-off. Nonetheless, stocks have been on fire since Donald Trump won the election. Seemingly every sector other than the gold sector is overbought. All you have to do is look at the financial sector Symbol: XLF (chart), the materials sector Symbol: XLB (chart), the industrials sector Symbol: XLI (chart) and the energy sector Symbol: XLE (chart) to see how overbought this market is. That said, stocks and or indexes can remain overbought or oversold for that matter for extended periods of time. Add into the mix Trump’s pledge to spend over $1 trillion on infrastructure here in the U.S. and the pledge to cut corporate and capital gains taxes and why would anyone think this rally could not continue?

It is easy to get caught up in the current euphoria of this breathtaking rally in the stock market and the promises of the incoming administration. However, let’s not forget what has been promised has to actually occur and if there is any back peddling by the new administration, the markets could react just as aggressively to the downside as they have to the upside. I am not suggesting that this will happen but we have all seen politicians make promises before they are elected only to change their tune after they take their respective seats. Which is why I do my best to tune out the noise and focus on overbought and oversold conditions. And this is where we find ourselves today. A very overbought market that I would expect will revert to the mean at some point in time.

Good luck to all 🙂

~George

oil chart George Mahfouz Jr

Uncertain Times And Near Record Highs!

Despite the uncertain times we find ourselves in vis-à-vis the upcoming presidential election, the Deutsche Bank balance sheet and liquidity concerns and the upcoming third quarter reporting season, stocks continue to defy the odds and remain within striking distance of all-time highs. The Dow Jones Industrial Average (chart) closed the third quarter at 18308, the tech-focused Nasdaq (see chart below) closed at 5312, the broad based S&P 500 (chart) finished the quarter at 2168 and the small-cap Russell 2000 (chart) closed at 1251.

I am truly amazed how strong the markets have been all things considered. We did see volatility spike in September which was no surprise. However, what was surprising is how short lived it was especially with how much concern and risk there is out of Europe and in particular Deutsche Bank. A couple of weeks ago the U.S. Department of Justice announced they were seeking a $14 billion dollar fine to settle Deutsche Bank’s mortgage lending activities during the 2008 housing crisis. Shares of Deutsche Bank stock plummeted on the news and raised concerns about the solvency of the bank. Stocks did react to the news but have seemingly shrugged off this potential risk to the markets. Furthermore, stocks so far have also shrugged off the uncertainty due to the upcoming presidential election. Monday’s presidential debate sparked controversy as to who won it, but it is clear that the markets saw that Hillary Clinton won the first round.

As we now enter the month of October, without question the headlines and chatter will only increase as we get closer to election day which is November 8th. I am expecting volatility to not only increase but to last longer than usual due to the amount of news flow that is forthcoming which includes the launch third quarter earnings reporting season. What I do in this type of market environment is tune out the noise and stay focused on the fundamentals and technicals of select stocks and indexes. I seek out and identify market dislocations including overbought and oversold conditions. My assumption is that as we get in the thick of third quarter earnings reporting season, overbought and for that matter oversold opportunities will present themselves. Good luck to all 🙂

~George


nasdaq chart george mahfouz jr

As Promised, Vol Is Back!

We knew it was only a matter of time. After trading in the most narrow range for the better part of the summer the VIX (see chart below) which is the ticker for the Chicago Board Options Exchange Volatility Index spiked this week over 60%!  This on fears that monetary policy changes are forthcoming here in the United States and abroad, especially as it pertains to interest rates. How is this a surprise though? There is not a day that goes by, in fact there is not an hour that goes by without headlines coming out pertaining to the Federal Reserve and what they will or will not do with interest rates.

Look my view is simple, count on it! Count on central banks changing their position on interest rates at some point in time. What amazes me is how much the markets and investors have become so reliant and seemingly make every investment decision based on whether interest rates remain near zero or begin to rise. How about this concept? Take a look at the premiums the markets have enjoyed over the past several years and minus that out. Then in my humble opinion we get back to fair value in stocks and markets. Although this has been one of the most profound bull markets in history, at some point in time equities are going to have to get off of the dependence on central bank accommodations. I look for ward to the day that we will be able to properly evaluate stocks and asset classes based on their respective fundamentals not on Federal Reserve policies.

Until then, the bulls can continue to enjoy the ride they have been on and I will continue to pay close attention to overbought and oversold conditions. With volatility back, this does create opportunity for the trader that is not too concerned with valuations. However, I expect that in the not so distant future, valuations will actually matter again. Good luck to all 🙂

~George

VIX chart George Mahfouz Jr

Is It Time For A Breather?

Stocks have been on a tear since the end of June with the key averages gaining close to 10% or more since coming off of their late June lows. That’s right double digit gains in a little over a month lead by the Nasdaq (chart) which is almost up 13%, followed by the small-cap Russell 2000 (chart) up 12.35% and both the S&P 500 (see chart below) and the Dow Jones Industrial Average (see chart below) closing up nearly 10% in that same time period. Part of the reason why the tech focused Nasdaq has led the charge is the stronger than expected and recently announced quarterly earnings results out of Amazon (NasdaqGS: AMZN) Apple (NasdaqGS: AAPL), Facebook (NasdaqGS: FB) and Google aka Alphabet (NasdaqGS: GOOGL).

So the question now is after such dramatic double digit gains in the aforementioned indices and in such a short period of time, is it time for a pause and/or a retracement? As you all know by now, the first thing that I look at when it comes to accelerated gains in any stock or index is the relative strength index also known as the RSI. The relative strength index is a technical indicator to determine overbought or oversold conditions, click here  for the complete definition. The RSI is also one of the favorite technical indicators used by market technicians, certain money managers and even select algorithms have the RSI programmed into their model. That said, the Nasdaq has now hit the 70 value level of the RSI which is an overbought level according to the RSI while the other key indices are not too far behind. Please note that indexes and stocks can remain overbought for extended periods of time.

So what does all of this mean? Well I think the set-up now is a little spooky. Not only are we at or approaching overbought conditions according to the relative strength index, but we now find ourselves in the month of August. August historically tends to be one of weakest month of the year for equities. In fact, over the past seven years the key indexes have fallen each year during this time period. History doesn’t always have to repeat itself, but the current set-up bodes well for a softer month ahead. We will see. Good luck to all 🙂

~George

S&P 500 George Mahfouz Jr

Dow Jones Chart George Mahfouz Jr

Record Setting Week!

A three-week stock market winning streak has propelled the Dow Jones Industrial Average (chart) and the S&P 500 (chart) to close at record highs. In one of the most dramatic turn of events from the shocking Brexit vote to today, these key indices were breaking records all week long. The Nasdaq (see chart below) and the small-cap Russell 2000 (see chart below) also posted a strong week of gains.

I stand corrected! In my previous blog I referred to the fact that the S&P 500 (chart) had been stuck in a trading range and that upcoming earnings reporting season should act as the catalyst to break stocks out of this range. Furthermore, my view was that corporate earnings most likely would underperform hence a breakdown out of this trading would be more probable. Well here we are today at record highs and we haven’t even gotten into the bulk of earnings reporting season. The largest U.S. bank J.P. Morgan (NYSE: JPM) did however report their results this past week posting a profit of $6.2B. J.P. Morgan’s results came in stronger than expected which also helped fuel this week’s rally, especially in the banking sector.

As much as we were oversold leading up to and just after the Brexit vote, the markets now find themselves approaching overbought territory. Now the question becomes what to do next? As mentioned above, we are full steam ahead into the bulk of earnings reporting season which can come with plenty of surprises. From a technical standpoint I find it hard to commit any new capital into a market at record highs and do so with most of corporate America yet to report their results. I will be paying attention to the top-line growth of companies to get more of an accurate read how their business is fairing compared to their bottom line which can be adjusted in many ways that may not tell the whole story. My concern now is how can record highs continue if top-line growth is not there in a meaningful way? Let’s look to next week to see if the record setting trend continues, or a pause and reversal comes forward.

Good luck to all 🙂

~George

George Mahfouz Jr. Russell 2000 chart

george mahfouz jr Nasdaq chart

Strong Month For Stocks!

Much to my surprise and to the surprise of many investors and traders alike, the major averages in October posted eye-popping results. For the month, the Dow Jones Industrial Average (chart) gained 8.7%, the tech-f0cused Nasdaq (chart) gained almost 10%, the S&P 500 (chart) notched an 8.3% gain and the small-cap Russell 2000 (chart) closed the month out up 5.55%. Yes almost double digit gains for the Dow, Nasdaq and the S&P 500. Now wait a minute, I thought the month of October is supposed to be one of the weakest months of the year for equities. I think in large part earnings reporting season has been a pleasant surprise to most investors and a continuing subdued Federal Reserve is responsible for the most recent gains and confidence in stocks. That said, I do think that this latest market run has been a bit too much too fast.

A quick look at the Relative Strength Index of the aforementioned indexes might also confirm my belief. The relative strength index is also referred to as the RSI. This particular indicator is one of the most watched technical indicators by seasoned traders and investors alike. The RSI compares the size of moves of gains and losses in a given period of time to highlight whether a stock or index is overbought or oversold. According to the RSI principles, the 70 value level or greater is considered an overbought condition and the 30 value level or lower is considered oversold. And as you can see with the Dow Jones Industrial Average (chart), the Nasdaq (chart) and the S&P 500 (chart), all three indexes recently hit or breached their respective 70-value line and reversed course on Friday. Now that does not mean that these indices could not break back through the 70 value level and continue onto higher levels and remain overbought for an extended period of time. What I am saying is that historically and from a technical point of view, the relative strength index has been quite reliable when markets overshoot to the up or down side.

We are now in the final two months of the trading year and let’s see how the markets react to this initial pullback we saw on Friday and whether or not this is the beginning of a slight correction to this extraordinary market run we experienced last month.

Good luck to all 🙂

~George

A Fresh Record High For The S&P 500!

It took a bit over a month since its last record closing high, but the S&P 500 (chart) on Friday indeed finished the week at a new record close of 2096.99. The Dow Jones Industrial Average (chart) closed above 18000 for the first time since the end of December as well. The tech-heavy Nasdaq (chart) now seems to be poised to go back through the 5000 mark, a level not seen since early 2000, and the small-cap Russell 2000 (chart) also closed at a record high at 1223.13.

Furthermore, both the S&P 500 (chart) and the Russell 2000 (chart) have technically broken out and could continue to notch further gains. This analysis is supported in part because both of these key indices have not yet reached overbought territory according to the Relative Strength Index/RSI. Remember, the RSI indicator signifies the 70 value level as an overbought condition for any given equity or index. The Relative Strength Index of the S&P (chart) and Russell (chart) are currently sitting around the 60 value level. So technically speaking and at least according the RSI, overbought conditions are not yet present.

With records being posted and breakouts occurring, is the economy or corporate profits really that good? Or is this a continuation of easy monetary policies worldwide? If I was a betting man, I would bet the latter. That said, how in the world can you go against the central bankers from around the world? I think the bulls will remain in charge for the foreseeable future, unless some unforseen catastrophic geopolitical event occurs.

Happy Presidents’ Day to all 🙂

~George

The Melt Up Continues…

Stocks continued their march north this past week as once again both the Dow Jones Industrial Average (chart) and the S&P 500 (chart) hit record highs on Thursday. Joining in on the action was the Nasdaq composite (chart) which hit a 52-week high on Thursday as well, while the small-cap Russell 2000 (chart) essentially closed flat on the week. We will talk more about this index in a bit.

With the mid-term elections in the rear view mirror and as the Thanksgiving holiday approaches, I do not see any reason as to why stocks in general won’t continue to post gains. Third quarter earnings reporting season for the most part has ended, and the scorecard was okay. You might look at the technical’s in the marketplace and see that we are at or heading into overbought territory. But when you have volatility coming in, the Thanksgiving holiday fast approaching and with no other real catalyst in the near term, it’s a perfect set-up for the status quo to remain in place. Here is the one exception; the small-cap Russell 2000 (chart). As the aforementioned key indexes have made all time highs, the Russell 2000 is lagging. Yes, this index too has rallied over 10% since the selloff in October, however, the Russell is running into significant resistance at the 1200 level, and actually has reversed course over the past two trading sessions (chart). It’s a bit early to call it a true reversal or a tell, but I will be keeping a close eye on how this key barometer pertaining to overall market sentiment will perform between now and year-end.

As far as the overbought conditions we find ourselves in according to the relative strength index, also known as the RSI, this is a prototypical environment where volatility is coming down and with not too many catalysts in the near term, I would not be surprised if we remain overbought through the end of the year. Good luck to all and both Paula and I wish everyone a Happy Thanksgiving holiday.

Have a great week 🙂

~George