Was That Window Dressing?
Was that window dressing that lifted stocks to close out the quarter? I wanted to share some thoughts on whether today’s market strength was the result of ” window dressing.” Window dressing occurs when fund managers or companies artificially inflate stock prices to strengthen their balance sheets and/or stock price, particularly as a quarter comes to an end. This practice is often driven by performance-based bonuses; managers aim for the highest possible closing price to maximize their measured quarterly results. When stocks rally in the final days of a quarter, it is frequently a result of managers squeezing additional performance out of their portfolios rather than a sudden surge in sales or fundamental strength of a given company. While this isn’t always the case, it is a common practice to keep in mind.
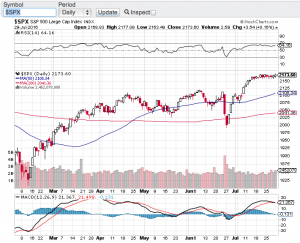
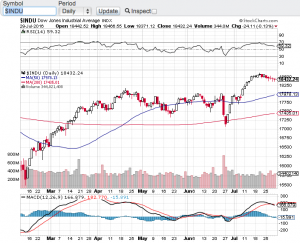
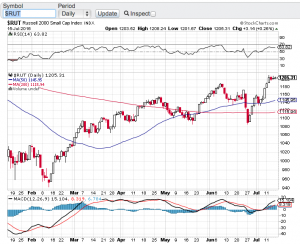
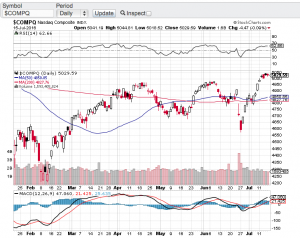
The stock market continues to be on a tear. The Dow Jones Industrial Average (see chart here) closed the quarter up 136 points at 52,319. The S&P 500 (see chart here) closed up 59 points at 7,499. The Nasdaq Composite (see chart here) closed the month and quarter up 393 points at 26,213. Finally, the small-cap Russell 2000 (see chart here) closed up 13 to close at 3,024. This week we also saw the Dow Jones Industrial Average (chart) hit an all-time high of 52,655.
Now comes the real test. With the second quarter concluded, I think the upcoming earnings season will be a critical test for these record price levels. The bar is set high; if companies miss expectations or provide conservative guidance, we could see significant pullbacks. I am particularly watching AI-related stocks, where underperformance could lead to 10-20% corrections or even more. Even with strong results, much of the growth may already be priced in. This earnings reporting season will likely determine the market’s trajectory for the second half of the year.
Have a safe and great 4th of July holiday weekend.
~George