Volatility Hits The Markets…

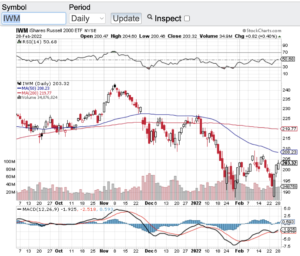
Volatility has hit the markets to the point that the VIX (see chart here) aka the fear gage has broken out. Stocks have been on a tear as of late but unfortunately to the downside. No one is surprised that the markets have become extremely volatile due to the Russian invasion of Ukraine. The Dow Jones Industrial Average (see chart here) fell over 10% since the crisis began as has the S&P 500 (see chart here). Both the Nasdaq Composite (see chart here) and the small-cap Russell 2000 (see chart here and below) have sold off closer to 15% before bouncing off of their sell-off lows. Again, no surprise that vol has spiked to almost a double over the past few weeks as tensions increased.

Before we get into the technical shape of the markets it’s hard for me to even talk stocks and indexes due to the atrocities happening abroad. Our prayers go out to everyone in the Ukraine that is being affected by this invasion and for the people of Russia who wants no part of this. Hopefully very soon a cease fire will happen and happen for good!

Now let’s look at the technical set-up that has occurred since the buildup and invasion with the aforementioned key indexes. Starting with the Dow Jones Industrial Average (see chart here). The Dow a few days ago hit a low of 32272 and has bounced to the 34,000 zone. There is much more work here to be done before the Dow can recapture its 100 and 200-day moving averages. The same can be said for the S&P 500 (see chart here) although with the S&P, it is closer to its 20-day M/A than the Dow Jones Industrials Average. Interestingly both the Nasdaq Composite (see chart here) and the small-cap Russell 2000 (see chart here) have bounced off of their recent lows stronger with the Russell 2000 recapturing its 20-day M/A. Despite the recent bounces off of their sell-off lows I think it is fair to say that we are not out of the woods yet in the volatility we have seen as of late. If you are a long-term investor, this will pass at some point in time. For experienced traders this is an environment where money can be made both on the long and short side of the markets. That said, I always recommend consulting your certified professional financial advisor(s) before making any moves in the backdrop we currently find ourselves.

Good luck to all 🙂

~George
Volatility Hits The Markets - Paula Mahfouz

What In The World?

What in the world is going on in the stock market? Millions of retail investors have formed an alliance and have taken on short hedge funds. Who would of thought that we would see the day that hedge funds that are specifically designed to short stocks would run into a short squeeze from an online trading group? This is what’s happening right now with GameStop (NYSE: GME) (click here for the definition of short selling). For decades these short hedge funds have targeted companies that appear to have weak fundamentals and no real prospects for growth which is why they targeted GameStop. The brick-and- mortar electronics retailer inherent business model has been challenged over the years due to the rise of digital gaming.

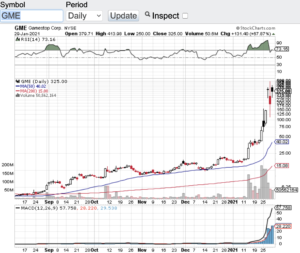
So, an obvious short, right? Fundamentally yes, but what has happened to the stock of GameStop is unprecedented. Never before has a unified online retail investor/day trading group targeted a company in the way that GameStop has been targeted while also targeting hedge funds that short sell companies. GameStop soared to a high of $483 per share last week while not that long ago GameStop was trading in the teens. In the month of January have witnessed unheard of returns with not only GameStop, but also with AMC Entertainment Holdings (NYSE: AMC) and department store Macy’s (NYSE:M) just to name a few. Pundits now are speaking to how this new “retail investor/day trading” strategy and cult like initiative is here to stay. Talk about disrupting the markets and impacting the short sellers’ model forever! I too believe this here to stay. That said, I also believe regulation will come forward to address the unimaginable volatility that these targeted stocks are experiencing. $200 dollar +/- price swings is happening with GameStop (see chart below) on an intraday basis that have even made the most experienced day and swing traders scratch their heads on how to trade the stock.

In closing, this is pure speculation and has no fundamental basis. Everyone knows GameStop is not worth $300-$483 per share not even close. To that end, this is a reminder of how stocks and stock prices can totally be disconnected to the fundamental value of a company. Please be careful trading these kinds of situations and it’s probably best to stay away!

Good luck to all 🙂

~George

What In The World? - Paula Mahfouz


Stocks Are In A Tailspin!

After starting the year off in sell mode, stocks are accelerating their declines and are now in correction territory. Yesterday’s rally sparked hope that a short term bottom was put in, however, this is not the case as the Dow Jones Industrial Average (chart) plunged 400 points at today’s open, the Nasdaq (chart) opened lower by over 100 points, the S&P 500 (chart) opened down over 2% and the small-cap Russell 2000 (chart) is now trading below 1000. What gives? First and foremost, China’s Shanghai Composite Index has lost over 20% of its value since late December and is now in a bear market. China’s market fall has indeed spilled over into the global markets. Secondly, crude oil (chart) has continued to decline and is now trading below $30 per bbl spreading fears of widespread bankruptcies in the oil and gas space. These two factors alone have been enough to send our markets into correction mode.

That said, what I try to do in this type of market environment is to place emotions in check and to keep things into perspective. Since this bull market began in 2009, we have not really experienced a market correction. Yes, it has been over six years since we have had a meaningful market decline that has stuck. People tend to forget that market corrections can be a very healthy thing for an overextended market. Investors and traders alike have been spoiled over the past six years by essentially taking their positions and switching on auto-pilot. I believe those days are gone and they should be. When the Federal Reserve took action and began their aggressive monetary policies i.e. buying bonds and placing interest rates at or near zero, stocks took off and did not look back. We have not been in a normalized market environment since then.

Fast forward to today and with essentially no Fed intervention and with a change in interest rate policy, we now have markets trading off of economic and corporate merits. This to me is not a bad thing because now investors can assess the value of the markets as well as individual stocks more accurately and more confidently. This is a concept that most traders and investors have been waiting on and that is to make their investment decisions based off of facts and not what the Federal Reserve will or will not do.

Good luck to all 🙂

~George

Rough Quarter For Stocks…

Although the markets rallied yesterday, the major averages in Q3 closed lower for the second straight month. In fact, year to date the Dow Jones Industrial Average (chart) is down 8.6%, the Nasdaq (chart) is off by 2.5%, the S&P 500 (chart) is lower by 6.8% and the small-cap Russell 2000 (chart) year to date is down 8.6%. So the bulls are asking what gives? My question is more of what has taken so long? The U.S. markets have not seen any kind of meaningful or long lasting correction in six years. This is not a surprise and if anything should be embraced. Stocks have been driven by the Federal Reserve policies ever since the introduction of the first quantitative easing mandate. How easy has this market been? All any investor or fund manager really had to do over the past 6 years is buy and hold with no need for concern. I think it’s safe to say the landscape is changing and rightfully so. There are many investors out there that missed this stunning bull run we have been on simply because it was hard to agree with the valuations that most of the market has enjoyed during the Federal Reserve buyback program and low interest rate stance. Top-line growth has really not been the catalyst that has driven stocks during this incessant bull market. However, when you are in a low to negative interest rate environment there really isn’t any other option to place funds. The question now is are we heading towards or already in a normalized market environment? Meaning will equities now begin to trade on their own merits? To me it certainly feels like the markets are setting up this way.

We won’t have to wait very long because third quarter earnings reporting season is just ahead. Without question I expect this upcoming earnings reporting season will be scrutinized like no other in recent memory. I believe gone are the days that investors will give any company a pass should their results come in under street estimates or even in-line with the street. For me personally there is too much volatility in the marketplace right now and my preference is to go to the sidelines until after Q3 earnings reporting season is over. I will then evaluate the landscape from a fundamental and technical point of view. Speaking of the technical shape of the market, this too of a concern of mine. All of the key indices are in a significant down trend trading well below their respective 200-day moving averages. Yes theses indexes are finding a bit of support right here, but if earnings reporting season doesn’t add up, new 52 week or even multi-year lows could be in the cards? My point here is that with the way the markets look and feel, it is probably best to be a bit more conservative until after we see the health and growth rate of corporate America. Good luck to all 🙂

~George

Volatility Is Back, Q3 Earnings Reporting Season On Deck…

After being in hibernation for most of the year, volatility is back at the forefront of the markets. The Volatility Index Symbol: VIX (chart) has spiked about 50% over the past couple of weeks which is a clear indication that investors are starting to get a bit nervous and fearful of the markets. The VIX demonstrates the next 30-day expectation of market volatility by calculating the implied volatilities of both puts and calls options of S&P 500 companies. Even the Dow Jones Industrial Average (chart) have experienced intraday triple digit swings over the past several trading days, something we have not seen in a long time. I think it is safe to say that the increase in vol is due in part to the markets continuing to post record highs, the fact that the federal reserve will be ending its asset purchase program this month and seemingly everyday now headlines of geopolitical uncertainty are abound . Furthermore, with the third quarter of the year now in the books, earnings reporting season is upon us. I don’t think it’s a coincidence that volatility has increased with all of the aforementioned factors in play. In fact, this particular earnings reporting season will  most likely be put under the microscope like no other recent quarter. Stocks have enjoyed the the accommodative policies of the Fed for the past several years and now one of the key components of the stimulus program will end here in October. As I mentioned in my previous blog, it will be up to corporate America to stand on its own two feet and begin to demonstrate top-line growth as they grow their earnings. Over the past couple of years many corporations have grown their bottom line by way of becoming more efficient, reducing their workforce and implementing stock buyback programs. I believe going forward financial engineering and in-house efficiencies won’t be enough to satisfy investors appetites.

As the third quarter ends and technically speaking, the Dow Jones Industrial Average (chart), the Nasdaq (chart), and the S&P 500 (chart) appear to be finding some support at their respective 50-day moving averages, however, the small-cap Russell 2000 (chart) continues to lag the big-caps and trade well below its 50-day and 200-day moving average. That said, what is impressive to me is even though volatility has picked up steam, most every pullback is met with support from willing buyers and sell-offs appear to be short lived. The concern I have is whether or not this pattern of support continues. As mentioned, Q3 earnings reporting season is on deck and I do not believe companies will be given free passes anymore to modest top-line growth. If you are a trader, this is type of environment that you have been waiting for. However, if you are an investor with a longer term view, then it is time to look at the intrinsic value of your holdings to reduce the impact of a higher vol environment. Also, options premiums tend to increase along with higher volatility which could bode well for option sellers. Whatever the case is, as we enter the last quarter of the year, I expect volatiily to continue and at points increase, which could create some panic selling and create great opportunities with the right companies. I am looking forward to this upcoming earnings reporting season and will look for oversold conditions to act.

Have a great October 🙂

~George


Overbought Conditions and Iraq Weigh In On Stocks…

After the Dow Jones Industrial Average (chart) and the S&P 500 (chart) set all time highs last Monday, the conflict in Iraq and overbought conditions spun a modest pullback in the key indices. Although some are attributing the selling pressure to the unexpected defeat of the House majority leader Eric Cantor (R., VA).  For the week, the Dow Jones Industrial Average (chart) lost 148.54 points, the tech ladened Nasdaq (chart) -10.75 points, the S&P 500 (chart) -13.28 points and the small-cap Russell 2000 (chart) closed slightly lower on the week. What has been eye popping to me is how complacent and tranquill market participants have been. Over the past several months and especially the past couple weeks, investor sentiment has been extremely bullish which in turn has sent the VIX to multi-year lows. The VIX, also know as the fear gaugeis used as an indicator of investor sentiment. Recently the value of the VIX (chart) hit a trough low of 10.73, its lowest level since 2006. Out of all of the market events that are going on, this indicator has me concerned more than any other. As much as I have been bullish on the overall markets, when sentiment gets this comfortable and the VIX trades this low, historically markets set up for a pullback or even a correction of sorts.

This set-up is just what both the bears and the bulls have been waiting on. I personally have been tempted to short this market considering the historic record breaking run up stocks have had. But I have learned a long time ago is you don’t want to step in front of the Federal Reserve or a freight train either, which is what this market has been. So my preference is to be patient, wait for whatever pullback(s) or correction we may get, and then begin to scale in on certain long positions. I will refer to the technical set-ups of indexes and certain equities to assist me in establishing entry points. Click here to see what I look at pertaining to technical analysis. Now whether you are a technical trader or fundamental investor, the fact remains that markets remain awash with liquidity thanks to the Fed, and there really is no where else to get the alpha that hedge funds and institutional investor alike need for their performance mandates. So knowing that these institutions really dictate the ebbs and flows of the markets, my bets will continue to align with theirs and over the past few years whenever we do experience an increase in market volatility and market pullbacks, a buy signal usually ensues. Please remember it is always wise to at least consult with a certified and trusted financial advisor(s) before you compose any investment strategy or make any investment decisions. Good luck to all.

Happy Father’s Day 🙂

~George

Despite a Partial Government Shutdown, Stocks Rally…

No matter what has been thrown at this bull market over the past few years, nothing seemingly can slow it down. After the key indices finished the month of September with unlikely gains, stocks continued their upward trajectory today even though Congress couldn’t agree on a short term budget deal to keep our government fully operating.

For the first day of October, the Dow Jones Industrial Average (chart) finished up 62.03 points, the Nasdaq (chart) +46.50 points, the S&P 500 (chart) +13.45 points and the small-cap Russell 2000 (chart) closed the day up 13.64 points. Pundits are speculating that with the government in a partial shutdown, Congress will now have to address the debt ceiling and budget at the same time which a likely compromise will come forward on both issues, hence, bullish for stocks. Not sure if I fully agree with that thesis. Furthermore, the bulls make yet another case that by having this budget and possible debt ceiling impasse, this will keep the Federal Reserve in full accommodative policy mode. Now this in my opinion would be a more bullish thesis. However, lets not forget we have now entered into the fourth and final quarter of the year and third quarter earnings reporting season is on its way.

Needless to say, the markets have a ton to digest over the coming weeks including Q3 earnings reporting season and I am expecting volatility to continue to increase. From a technical standpoint, the Nasdaq (chart) and the small-cap Russell 2000 (chart) stunningly hit new 52-week highs today and continue to outperform the Dow Jones Industrials (chart) and the S&P 500 (chart). The Dow and S&P did bounce off of key support levels yesterday and have resumed their uptrends, at least for now. In addition, both the tech-heavy Nasdaq (chart) and small-cap Russell 2000 (chart) are once again approaching overbought territory heading right into earnings reporting season, which could be of interest to the bear camp.

As volatility increases, one strategy that can potentially bode well is to sell option premium on select indexes or stocks in order to capitalize on the increased vol. This strategy is not for the novice and one should consult with a certified financial consultant before implementing any strategy, especially options strategies. But for the more advanced investor or trader, this type of environment is almost perfect to participate in a “selling option premium” program. Option premium is essentially income generated by an investor who sells premium to another party and hopes to keep the entire premium without having the option exercised. Let’s look at one example of a “selling premium, covered call strategy”. Let’s assume you own 1000 shares of Facebook (NasdaqGS: FB) at $50 per share. You can choose to “sell” a.k.a.”write” a covered call option on the Facebook shares you own. If you take the monthly October $52.50 calls that are currently trading for $1.20 and sell/write them against your position, you would take in $1,200.00 less transactions costs. This is the premium you would receive for writing/selling this covered call. If Facebook closes below $52.50 on expiration day you keep the entire premium as well as your 1000 shares. If Facebook closes above $52.50 on expiration day you still keep the entire premium earned, however, your 1000 shares of Facebook would be called away at $52.50 because you sold your rights to the stock you own to another party for $52.50. If this is the case, you would be a not only be benefiting from the options premium income, but also a stock appreciation outcome for in this example the initial cost basis for the Facebook position is $50.00 per share. So you would gain an additional $2.50 per share in profit. Please note that a covered call strategy is typically a bullish strategy and again this is just one example of how “selling options premium” can work. In closing, this is not a recommendation just an illustration on how an investor or trader can potentially benefit with option premiums. Please remember it’s always best to consult with a certified financial planner(s) before implementing any investment strategy.

Good luck to all 🙂

~George


Impressive resilience…

Despite the incessant flow of “fiscal cliff” news from all of the media outlets, stocks continue to hold their own. For the week, the Dow Jones Industrial Average (chart) closed up 1%, the S&P 500 (chart) + 0.13%, the Nasdaq (chart) -1.07% and the small-cap Russell 2000 (chart) finished the week flat. Not too shabby considering all of the fear and uncertainty surrounding the fiscal cliff and that Washington has not really progressed towards a deal.

With only a few weeks left in trading year and the fiscal cliff deadline, what is an investor or trader to do? Well if you are a trader you should love this type of environment. I am expecting volatility to pick up steam between now an year end. This should present larger market swings and provide excellent trading opportunities both on the long and short side. If you are an investor you may want to sit it out until we get a deal out of Washington. I remember the days when you would make investment or trading decisions based on fundamentals and technical analysis. Now seemingly the biggest factors are whether or not the central banks will continue to support the markets and whether or not Washington can get along. Needless to say, this dynamic has placed additional uncertainty on the markets and investors or traders now have to add this in the mix of their decision making processes. Good luck to all.

Have a great weekend 🙂

~George