Soft Month For Stocks…

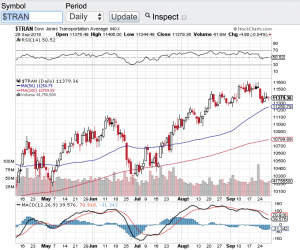
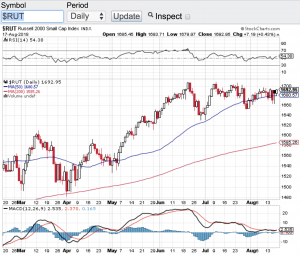
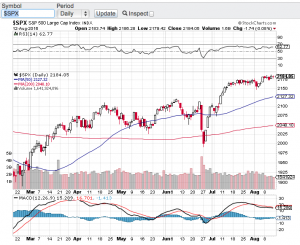
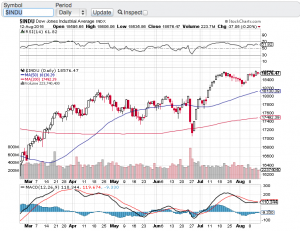
August was a soft month for stocks across the board. The Dow Jones Industrial Average (see chart here) closed the month of August down 2.4%, the S&P 500 (see chart here) fell a modest 1.8%, the Nasdaq Composite (see chart here) gave up 2.2% and the small-cap Russell 2000 (see chart here) fell by over 5%. All things considered, not too shabby considering August historically is one of the weakest months of the year for stocks.

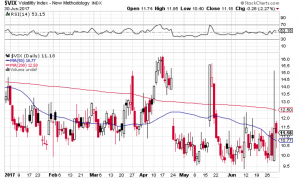
The market performance in August did snap a 5-month winning streak for the S&P 500 and the overall volatility in the stocks also picked up some steam. However, I do think the bulls will take such a modest pullback considering how strong the markets had been since early June. It appears some profit taking occurred in August while overall trading volumes were relatively lower. Now that summer is almost behind us, I expect trading volumes to increase along with the possibility of bigger market swings as we head into fall.

Now that we are in September the question becomes can the market weakness in August turn around in September? I typically look for catalysts to see if market direction will turn and as we head into September overall bullish sentiment has decreased. As contrary as this may sound, bullish sentiment decreasing is usually a bullish sign for the markets. I don’t like participating in markets where the sentiment is overly bullish and this has been the case all summer long, especially with how AI stocks went on a tear over the summer. The Artificial Intelligence sector lifted most indexes and if it wasn’t for the AI craze we have witnessed, I am not so sure if the markets would have enjoyed a multi-month bull run.

I always like to look at the technical shape of the markets as another potential catalyst for market moves. There is nothing really standing out either bullish or bearish. From the relative strength index aka the RSI, to where the moving averages are currently positioned, there is nothing too glaring one way or the other. Not a surprise considering how low the trading volumes were in August and the modest pullback that did occur.

Good luck to all šŸ™‚

~George

The 200-Day Moving Average Holds!

The 200-day moving average held its ground despite the constant tape bombs and tweets that continues to come out of Washington. It is no secret that stocks have been on a wild ride over the past few weeks from making all-time highs to rip roaring selloffs. The continuation of tariff threats out of Washington has been a huge catalyst for the increase in volatility in stocks. That said, with all of the madness that is swirling around the Dow Jones Industrial Average (see chart here), the S&P 500 (see chart here) and the Nasdaq Composite (see chart here) have all managed to stay above their respective 200-day moving averages. This key technical support line has held true to form during these market selloffs. The small-cap Russell 2000 (see chart here) has not been as fortunate and could not hold its 200-day.

So in addition to the Washington D.C. threats of additional tariffs, the markets also had to deal with the dreaded 10-year and 2-year yield curve inverting. Whenever longer term interest rates fall below shorter term interest rates in the bond market that historically is a signal that a recession might be looming. Now there is a meaningful lag here whenever we see the yield curve inverting, so as long as the curve flattens out and returns to a normalized dynamic, we should escape the threat. However, if the yield curve remains inverted for an extended period of time then we could be in for something else.

Let’s get back to the technical shape of the markets. As mentioned, three of the four major averages held above their respective 200-day moving average support line which is a good thing technically. What also helped is during these meaningful selloffs is that the markets did go into oversold territory and technically bounced. Let’s see how the next couple of weeks shape up as we wind down the dog days of summer.

Good luck to all šŸ™‚

~George

A Market Selloff That Just Did Not Happen…

As summer ended where was the market selloff? Instead of conforming to what historically are the weaker months of the year whereas stocks at the very least should of paused with lighter volumes, the major averages hit all time highs. The Dow Jones Industrial Average (chart), the S&P 500 (chart), the Nasdaq Composite (chart), the small-cap Russell 2000 (chart) and even the Dow Jones Transportation AverageĀ (see chart below) all hit record highs in the third quarter. In fact the broad based S&P 500 (chart) turned in its best quarterly performance in five years. In my previous blog, I spoke to how traders and investors alike are awaiting a September selloff but seemingly nothing can stop this perma-bull market! Not trade wars, not interest rates, not the threat of inflation, not the daily chaos out of Washington, not historic seasonality, I mean nothing has stopped this bull market. Without a doubt this has been a close your eyes and a “go long” market. If you just did that over the past decade, you would of been part of 100% plus gains and whoever did do that, congratulations!

So now begs the question of what now? What now is fourth quarter earnings reporting season and oh yes the mid-term elections! October will not only be loaded with corporate earnings reports but there is also this little event call mid-term elections. I think it is safe to say that at the very least volatility shouldĀ  rear its head up. As the summer trading months were unfolding vol went back to its “low vol” standard as we have witnessed for past decade. There is just no fear in the markets. The volatility index aka the VIX (chart) is a measure of investor fear and in this case, lack thereof. I have got to believe that volatility will increase as we head into earnings reporting season and especially as we approach mid-term elections. Good luck to all! šŸ™‚

~George

Dow Jones Transports - George Mahfouz Jr

Trading Between The Lines…

Trading between the lines is how this August is playing out so far. In what is supposed to be a seasonal volatile period, August seemingly has been playing right to the tune of this almost decade long bull market. The Dow Jones Industrial Average (chart), the S&P 500 (chart), the Nasdaq Composite (see chart) and the small-cap Russell 2000 (see chart below) to my surprise have all traded in a tight range this month. Furthermore, the 20-day moving average and even more so the 50-day moving average have played a major role in supporting the indexes whenever any selling does come in. Now we have had a couple days here in August where it looked like these support lines would be breached and in fact in some instances they were. However, whenever these support lines were touched or breached, buying came right in and placed a floor beneath the selling pressure.

I am not sure how the rest of the month will play out but August at least from a seasonality perspective still has the potential to demonstrate volatility and experience meaningful selling pressure. I really do believe that the bear camp expected to see August as their month, but from the looks of things the bears may have to wait until September or beyond. Corporate earnings for the most part have been topping expectations, the economy is seemingly firing on all cylinders and rising interest rates are not that big of a factor yet to be weighing heavily on stocks.

My plan for the rest of the month is simple. Pay attention to the support and resistance zones of the aforementioned indexes and for that matter any stock that I am considering to trade. Secondly, I need to see the trading volume pick up before any definitive trend can be trusted. The market volume just has not been here this month which is also typical of the dog days of summer. Patience is the keyword between now and month end. That said, I expect after the labor day holiday we will be having a much different conversation. Good luck to all šŸ™‚

~George

Russell 2000 - Paula Mahfouz

Where Is The Vol?

As the second quarter came to a close yesterday volatility is no where to be found. The CBOE Market Volatility Index also referred to as the VIX has been pretty much dormant this entire year (chart). Typically vol ticks up as we approach summer for a variety of reasons such as earnings reporting season, seasonality and of course the Federal Reserve policy actions. As expected the Fed did raise rates in June but the markets appear to be pricing in a higher interest rate environment. So far this year the Dow Jones Industrial Average (chart) is up 8.03%, the S&P 500 (chart) is up 8.24%, the Nasdaq Composite (chart) is up a whopping 14% and the small-cap Russell 2000 (chart) is up a modest 4.29%.

Seemingly everyday stocks are in melt-up mode. There are days where volatility tries to rear its head up, but that does not last very long. (See chart below). Even when Goldman Sachs came out with a bearish report on June 9th comparing the red-hot tech sector to the internet bubble era, the negative effect of that report lasted only a couple of days before tech found support and then proceeded to make new highs. The traders and investors that are waiting for the proverbial 10% or more correction are just not getting it. Buying the pullbacks is what has been working ever since the election but the problem is that if you are not stepping in on the 1-3% percent retracements, you are missing the next leg up. How much longer can this type of market environment last? Now that Q2 is in the books, earnings reporting season will soon begin. Let’s see if corporate earnings continue to come in stronger than analyst expectations and if so, stocks may just continue to remain bulletproof.

A quick gander at the technical shape of the aforementioned indexes and there are no signs of overbought or oversold conditions according the relative strength index. Therefore I am expecting vol to remain relatively low until at least second quarter earnings season begins. Good luck to all!

Both Paula and I wish everyone a very safe and happy Fourth of July holiday weekend šŸ™‚

~George

VIX Chart - Paula Mahfouz

What August Swoon?

Actually quite the contrary! In fact new all time highs occurred this past week with theĀ S&P 500Ā (see chart below), theĀ Dow Jones Industrial AverageĀ (see chart below) and the Nasdaq (chart,Ā click here). What’s more is these record closing highs of the aforementioned indexes occurred on the same day last week, a feat that has not happenedĀ since the bubble of 2000. Now I am not suggesting we are in a bubble like we were in dot-com days. Back then valuations of dot-com stocks and most of technology were rather insane. That said, the current price to earnings ratio of the S&P 500 is in the 20’s which is historically high. That alone could be a catalyst for a pause and consolidation and/or aĀ pullbackĀ from the record high territory we have been trading in.

I am almost frightened to think or suggest that a retracement of any type is forthcoming simply due to the way the markets have been trading in a typically weak market season. As mentioned in my previous blog, August tends to be one of the weakest months of the year for the stock market. There is still a couple of weeks left in August and it is not too late to see historic trends surface. However,Ā the way stocks have traded lately and with no real economic or geopolitical catalysts in the foreseeable future, this market melt-up may indeed continue.

Technically speaking, the trend lines of the 20-day, 50-day and 200-day moving averages all remain in tact and are yielding upward and the relative strength index of the key averages are not officially in overbought territory. So this is enough for me to not really expect much out of the market in either direction as we head intoĀ Labor Day weekend and as the summer winds down. Good luck to all šŸ™‚

~George

S&P chart george mahfouz jr

dow jones chart george mahfouz jr