Record Highs Continue…

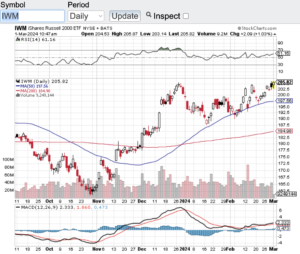
Record highs continue for the Dow Jones Industrial Average (see chart here) and for the S&P 500 (see chart here). In February, the Dow Jones Industrials hit an all-time high of 39282 while for the first time ever, the S&P 500 (see chart here) crossed the 5000 mark trading as high as 5111. These two indexes continue to demonstrate impressive strength along with the Nasdaq Composite (see chart here). It appears that the Nasdaq Composite just might join the Dow Jones Industrials and S&P 500 in hitting a fresh all-time high anytime. The small-cap Russell 2000 (see chart here & below) still has a way to go to reach its all-time high but at least this index is trending up.

Stocks aren’t the only asset class at or near all-time highs, Bitcoin has broken out as of late and has surpassed $60,000 per coin mark. The momentum continues here since Bitcoin ETFs were approved. Now this asset class in not for the faint of heart. As much as Bitcoin continues to rip, sell-offs in this asset class can be dramatic and fast.

So, what is going on with these all-time highs and the “risk on” spirit from institutional investors and retail investors alike? For one, I think the strength of the economy has something do to with this, however, I believe that rampant speculation is also play a role. Especially out of the artificial intelligence sectors as stocks there also continue to make all-time highs. My concern is how long this most recent rally has lasted. For example, the S&P 500 (see chart here) has seen gains in 15 of the last 17 weeks which is rarely seen.

With that being said, as I look at the technical shape of the aforementioned indexes, they are not in overbought territory according to the relative strength index aka the RSI. Many market technicians use this key technical indicator to gage whether a stock or index is overbought. 70 is the key value level of the RSI that would indicate an overbought condition and the major averages are trading below this mark. Now this is only one technical indicator and there are clearly many other factors that determine the state of the markets, but as of now nothing appears to be getting in the way of this impressive months long rally.

Good luck to all 🙂

~George
All Time Highs Continue - Paula Mahfouz

Soft Month For Stocks…

August was a soft month for stocks across the board. The Dow Jones Industrial Average (see chart here) closed the month of August down 2.4%, the S&P 500 (see chart here) fell a modest 1.8%, the Nasdaq Composite (see chart here) gave up 2.2% and the small-cap Russell 2000 (see chart here) fell by over 5%. All things considered, not too shabby considering August historically is one of the weakest months of the year for stocks.

The market performance in August did snap a 5-month winning streak for the S&P 500 and the overall volatility in the stocks also picked up some steam. However, I do think the bulls will take such a modest pullback considering how strong the markets had been since early June. It appears some profit taking occurred in August while overall trading volumes were relatively lower. Now that summer is almost behind us, I expect trading volumes to increase along with the possibility of bigger market swings as we head into fall.

Now that we are in September the question becomes can the market weakness in August turn around in September? I typically look for catalysts to see if market direction will turn and as we head into September overall bullish sentiment has decreased. As contrary as this may sound, bullish sentiment decreasing is usually a bullish sign for the markets. I don’t like participating in markets where the sentiment is overly bullish and this has been the case all summer long, especially with how AI stocks went on a tear over the summer. The Artificial Intelligence sector lifted most indexes and if it wasn’t for the AI craze we have witnessed, I am not so sure if the markets would have enjoyed a multi-month bull run.

I always like to look at the technical shape of the markets as another potential catalyst for market moves. There is nothing really standing out either bullish or bearish. From the relative strength index aka the RSI, to where the moving averages are currently positioned, there is nothing too glaring one way or the other. Not a surprise considering how low the trading volumes were in August and the modest pullback that did occur.

Good luck to all 🙂

~George

A Mixed Month For Stocks…

The month of May was a mixed month for stocks and the major averages. The Dow Jones Industrial Average closed out the month down 3.5% (see chart here) while the S&P 500 (see chart here) and the Nasdaq Composite closed the month out in the green. The small-cap Russell 2000 (see chart here) like the Dow closed the month out lower. Not bad considering how the debt ceiling issue and debate has been in the news seemingly hourly as everyone waits with bated breath as to what Congress will do. To me I wonder why this drama about raising the debt ceiling so the government can pay its debt and obligations is always a thing? Why even have a debt ceiling when there is no way United States of America could ever default on its debts and obligations. If this was to occur a global meltdown like never before seen could occur. How about this concept? No debt ceiling at all and instead vote in a fiscally responsible administration and politicians to manage our country’s finances properly. Sounds simple enough, but who am I kidding. Ok, enough of this and back to the markets.

Despite being an historically softer month for the stock market, May did not perform too bad as evidenced above. Yes, a mixed bag, but I think investors are happy to see that we didn’t fall off a cliff. That being said, as a look at the technical shape of the aforementioned indexes what is standing out to me is how key support lines are in play. The Dow Jones Industrial Average (chart) is hovering right around its 200-day moving average, while the S&P 500 (chart) is currently being supported by its 20-day moving average. The Nasdaq Composite (chart) is trading nicely above it’s 20, 50 and 200-day moving averages while the small-cap Russell 2000 (chart) is bouncing around its 20-day MA.

Lastly, I think the markets are in a position to continue its recent trading patterns and as soon as the final vote comes in on the debt ceiling matter, everyone will breathe a sigh of relief.

Good luck to all 🙂

George

A Tough Quarter For Stocks…

It was a tough quarter for stocks as the markets dealt with and continues to deal with the war in Ukraine, runaway inflation, rising interest rates and the seemingly never ending Covid dynamic. For Q1, both the Dow Jones Industrial Average (see chart here) and the S&P 500 (see chart here) lost nearly 5%. The Nasdaq Composite (see chart here) lost more ground closing out the quarter down 9%. Last but not least, the small-cap Russell 2000 (see chart here )  also closed Q1 down 9 %.

As mentioned above, it was a tough quarter for stocks and indexes but with the current state of global backdrop my feelings are we are quite lucky to not of experienced more of a drawdown. In fact, I am very surprised if not shocked that we did not see a 20 percent sell-off or more due to these major headwinds. So, this begs the question as to why there was not more of a correction? Could it be corporate earnings will surprise the street once Q1 earnings reporting season kicks off here in April? Or could it be that while interest rates are going up and will continue to do so, that rates are still relatively low, and money continues to get put to work in the overall markets? I do think that this upcoming earnings reporting season will be one of the most important metrics in years pertaining to whether stocks find their footing or continue to be under pressure. The one other metric I will be paying close attention to is yield curve inversion. For the first time in years the 2-year Treasury yield surpassed the 10-year and historically when that happens the chances for a recession increase. So, as you see there is much to learn over the coming weeks and throughout the summer.

Last but not least, when I look at the current technical shape of the aforementioned key indexes, all of them are trading right around their respective 20-day, 100-day and 200-day moving averages. Based on this action it is possible that we see a breakout above and/or a breakdown below these historic support and resistance lines.

Good luck to all 🙂

~George


Healthy Corrective Action – Or Something More?

Are we in a healthy correction or is this something more? The recent market selloff including yesterday’s 500 point drop on the Dow Jones Industrial Average (see chart here) has caught the attention of investors and traders alike. The S&P 500 (see chart here) experienced its toughest month in over a year closing down almost 5%. The Nasdaq Composite (see chart here) was lower by over 5% in the month of September. It is not too surprising that the major averages were weaker to close out the third quarter. Historically, September and October for that matter are usually softer months for stocks.

So back to the question is this healthy corrective action or the beginning of a meaningful drawdown? The answer depends on who you ask or how you are interpreting the Federal Reserve’s updated guidance to the monetary policies that the Fed has in place. It is hard to be bearish here based on where the Federal Reserve currently stands. In one breath we hear that “bond purchases” will start to taper off before year end. Then in another breath, the Fed continues to signal that they are prepared to support our economy in the event we experience another surge in Covid. My feelings are the Fed will not put the brakes on their easy monetary policies until such time that our country is out of this pandemic. One thing is for sure, each upcoming Fed policy meeting and subsequent guidance will be put under a microscope more now than ever.

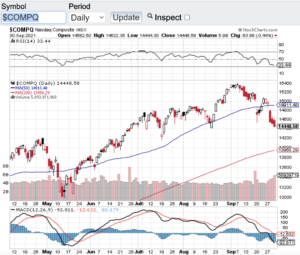
Let’s take a quick gander at the technical shape of the aforementioned indexes. The Dow Jones Industrial Average (see chart here) closed yesterday just below 34000 with its 200-day moving average currently at 33360. The S&P 500 (see chart here) closed yesterday at 4307 while also breaching and closing below its 100-day moving average. The Nasdaq Composite (see chart below) closed the month of September at 14448 also breaching its 100-day moving average. So the current technical set up could mean more downside ahead, but on the other hand, if these moving averages hold and acts as support, we could see a strong relief rally.

Good luck to all 🙂

~George

Healthy Corrective Action - Or Something More? - Paula Mahfouz


A Week To Forget…

Certainly, a week to forget! Not since the depths of the 2008 financial crisis have we seen volatility so high (see chart here) as stocks and indexes react to the spread of the coronavirus. Last week, the Dow Jones Industrial Average (see chart here) saw multi-thousand point swings. The S&P 500 (see chart here) was not spared from the highest volatility in a decade. The Nasdaq Composite (see chart here) and the small-cap Russell 2000 (see chart here) both experienced eye-popping swings as well. However, on Friday the President declared a national emergency and he announced a $50B relief package to combat the coronavirus. Stocks took that cue and had one of their best day’s ever with the Dow Jones Industrial Average (chart) soaring almost 2000 points, the S&P 500 (chart), the Nasdaq Composite (chart) and the Russell 2000 (chart) all gaining almost 10% on the day.

Now we find ourselves in a highly volatile environment that in my opinion won’t abate until more metrics come forward pertaining to the spread here in the U.S. and the plans to contain it. The administration took a huge step yesterday by declaring a national emergency and to promise the full resources of the government to combat and control this virus. Furthermore, the government is waiving interest rates on student loans and committed to buying oil from U.S. companies to “fill up our strategic reserves”. It’s no wonder stocks had one of their best days in history.

I always like to conclude my blogs with a take on the technical shape of the key indexes. Needless to say there was a lot of technical damage done last week pertaining to technical makeup over the markets and in particular the moving averages. All of the major indices broke their respective 20-day, 100 and 200-day moving averages. These are all significant support zones that have been broken through. The one bright spot in this dynamic is the selling was so severe that after the dust settles strong rallies can and do typically occur as we witnessed on Friday. We are also now way below the key moving averages that often times the markets go back to retest those averages. If this does occur the set-up is very promising for bargain hunters. That said, I am not suggesting that the markets will rip roar back anytime soon, but historically strong rallies do occur after panic selloffs.

Good luck to all 🙂

~George

New Week, New Record Highs?

New week, new record highs? The Dow Jones Industrial Average (see chart here) and the S&P 500 (see chart here) are fast approaching all-time highs. Both of these major indexes have been on a tear of late and could see new record highs this upcoming week. However, breaking news came out yesterday that Saudi Arabia has shut down half of its oil production after drones attacked the world’s largest oil processing facility. This attack will impact 5 million barrels of daily oil production. One sector that will certainly be affected is the energy space. The price of oil is now expected to skyrocket at least here in the short term. I am not sure if the markets will shrug this dynamic off, but I do expect energy stocks to outperform.

As I take a look at the Nasdaq Composite (see chart here) and the small-cap Russell 2000 (see chart here) both of these indexes appear to be ready to breakout and join the Dow Jones Industrials and the S&P 500 most recent performances. If the news out of the middle east has a negative impact on stocks, there are plenty of technical support levels that would come into play. All of the aforementioned key indexes are trading comfortably above their 20-day, 100-day and 200 day moving averages. During the month of August the 200-day moving average provided major support multiple times. As I look at the relative strength index to see how close we are to overbought conditions, there is still plenty of real estate before we see the 70 level of the RSI. So technically speaking the indexes appear to be in relatively good shape.

Without question the oil markets and the energy sector will be the focus this week. I am also curious to see how the overall markets react to this latest development out of the middle east. Good luck to all 🙂

~George


Dow, Nasdaq And S&P All At Record Highs!

The Dow Jones Industrial Average (see chart here), the Nasdaq Composite (see chart here) and the S&P 500 (see chart here) are all at record highs. Stocks continue to be on a tear with 3 of the 4 major indexes closing at all time highs on Friday. What’s more the S&P 500 (see chart here) closed above the 3000 mark for the first time ever. The one index that still has work to do before making a new high is the small-cap Russell 2000 (see chart below). I am not exactly sure why the Russell is lagging behind the big boys but if the Russell 2000 gets going then who knows how many more records will fall.

That said, for the first time in a while the Dow Jones and the S&P 500 have both entered into overbought territory which is above the 70 value level of relative strength index also know as the RSI. The Nasdaq Composite is fast approaching overbought conditions as well. The Russell 2000 is no where near overbought. I do expect a bit of a pullback in the coming weeks which would be rather healthy for stocks after such a strong performance. I have never been a fan of buying into record highs although momentum traders would disagree. Another factor to consider is we are heading right into second quarter earnings reporting season. Earnings reporting season could be a catalyst to pause the summer rally especially with the percentage of companies issuing warnings so far (click here)

The tariffs that our administration have imposed is expected to have a negative effect on the top and bottom lines of many U.S. companies. What I will be looking for is how much of an affect these tariffs are having on corporate America. The other side of the coin is if tariffs weigh heavier than what is anticipated, this could be yet another reason for the Federal Reserve to move to cutting interest rates which is the real reason I think we are hitting all time highs. Good luck to all 🙂

~George

Russell 2000 - Paula Mahfouz


One Hot June!

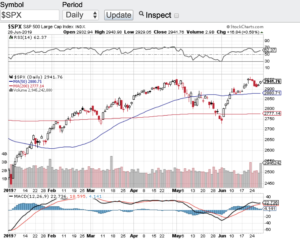
One hot June indeed and I do not mean the weather folks! Stocks and commodities went on a tear in the month of June logging the best June in decades for some of the indexes and other asset classes. The Dow Jones Industrial Average (see chart here) soared over seven percent last month. The S&P 500 (see chart below) hit an all time high in the month of June while both the Nasdaq Composite (see chart here) and the small-cap Russell 2000 (see chart here) notched impressive gains as well. What’s more is both oil and gold surged right along side of the key indexes.

So why the rally? I think the answer is simply an easier monetary posture by the Federal Reserve. It is no secret that inflation is well in check and it is also becoming apparent that the U.S. job market is cooling off. Another factor for the Fed to consider is what impact would a full blown trade war with China do to the U.S. economy? This is why in my opinion we are seeing a continuing upward trend in our markets and that is a dovish Fed is usually very good for stocks. One other factor that will certainly weigh in is the upcoming earnings reporting season. Now that the second quarter of the year is in the books we will see how well corporate America did in Q2 as earnings reporting season gets underway this month. I will continue to look to monitor how “top-line” growth is faring.

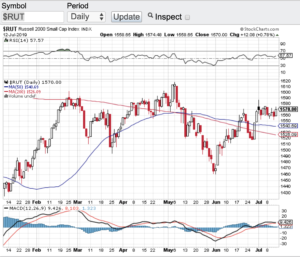
Let’s take a quick look at the technical shape of the key indexes. After surging over 7% in June, the Dow Jones Industrial Average (see chart here) remains clearly above its 20-day, 100-day and 200-day moving averages as does the S&P 500 (see chart here). The Nasdaq Composite (see chart here) is in a healthy technical condition and last but not least, the small-cap Russell 2000 (see chart here) has broken above its key moving averages. This is a very good sign for stocks and furthermore none of indices are in overbought territory according to the principles of the RSI also known as the relative strength index.

Both Paula and I wish everyone a very safe and Happy 4th of July holiday 🙂

~George

S&P 500 - Paula Mahfouz


Stocks End Q1 On Fire!

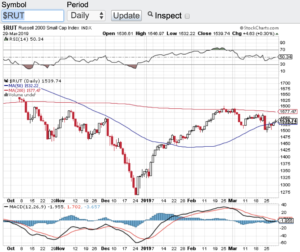
Stocks ended the first quarter of the year on fire! The Dow Jones Industrial Average (see chart here) closed Q1 up over 11%, the S&P 500 (see chart here) closed the first quarter up over 12% which is the best performing quarter in years for this bellwether, the Nasdaq Composite (see chart here) closed up more than 17% and the small-cap Russell 2000 (see chart below) closed out the first quarter of the year up over 14%. Yes folks these gains are incredibly impressive especially considering how global growth is slowing. That said, these eye-popping market gains are not too surprising considering the sharp sell-off that stocks experienced in that latter part of 2018. Without a doubt the aforementioned indexes were way oversold in late December and an oversold bounce of some sort was definitely in the cards. As we know, market swings can and do overshoot to downside such as what we saw in late 2018 and now the question is, will we overshoot to the upside?

It sure does not appear that way at least from a technical perspective and according to the Relative Strength Index (RSI). The Dow Jones Industrial Average (see chart here), the S&P 500 (see chart here), the Nasdaq Composite (see chart here) and the small-cap Russell 2000 (see chart here) are no where near overbought conditions yet. This despite all of these key indices rallying double digits in Q1. What’s more, all but one of these indices are also trading above their key moving averages including their 20-day, 100-day and 200-day with the lone exception being the small-cap Russell 2000. Now there could be some consolidation going on here over the next few weeks and up until first quarter earnings reporting season begins which would actually be healthy for the markets.

Speaking of the upcoming earnings reporting season, this could be the one catalyst that sheds the most light for the rest of the year on how stocks will fare. It is no secret global growth has slowed and I think corporate America will speak to whether this current global slowdown is just a blip on the radar or something much more meaningful.

Good luck to all 🙂

~George

Russell 2000 - Paula Mahfouz