The Technicals Are In Play…
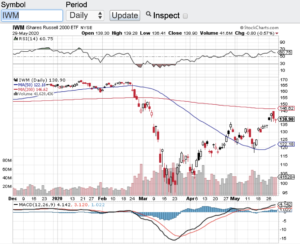
As the markets try to find their footing, the technicals are surely in play. After a record-breaking performance over the past few months, the major averages are flirting with breaking down. The Dow Jones Industrial Average (see chart here) recently broke down below its 20 and 100 day moving average, as did the small-cap Russell 2000 (see chart here). Both the S&P 500 (see chart here) and the Nasdaq Composite (see chart here) have broken down through their 20 day moving averages, however, these indices are finding support at their 100-day M/A.
The recent market action to me is no surprise. As I alluded to in my previous blogs, month over month stocks and the major averages have been setting all-time highs. At some point in time a pause and reversal in stocks is to be expected. That time appears to be here and now. Of course, there are other factors weighing in on the markets recent pullback with the spotlight coming back on to the inflationary backdrop our economy has faced. Inflation has dropped dramatically over the past year, however, recently there has been an uptick in key sectors, click here for a recent report on the consumer price index. Now pundits are tying the most recent consumer price index into a narrative that the Federal Reserve may not be cutting interest rates after all. Some economists are even suggesting the Fed may even hike rates should inflation continue to uptick.
I come from the camp that a bump in the road with a slight uptick on inflation is nothing to panic over. Now if over the next couple of months the CPI continues to rise, then this would be a different discussion. In the near term if the major averages are able to hold here at the key support zones, then the recent pullback should find some footing. If the selling pressure continues then the 200-day moving average could be the next stop.
Good luck to all 🙂
~George