Are The Indexes Out Of Balance?

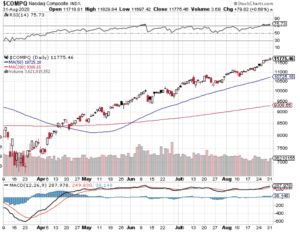
With how hot tech stocks have been lately, one has to ask are the key indexes out of balance? Let’s take a look. It is no secret tech stocks have been on fire, the Nasdaq Composite (see chart here) has been setting records weekly. Stocks like Tesla, Apple and Amazon continue to set all time highs. Price to earnings ratios aka the P/E ratio are also expanding to levels not seen since the tech bubble of the early 2000’s. I am not suggesting that tech as a whole is in a bubble, but there can be an argument that certain tech stocks are. I am not singling out Tesla at all, but what I am highlighting is the company’s eye-popping 1000 + P/E ratio. The price to earnings ratio is a metric for valuing a company that measures its current share price to its earnings per share. For example the S&P 500 typically trades in the 15-20 P/E range. Yes, a 15 to 20 P/E multiple is the historic price to earnings multiple that the S&P 500 trades at. So when you look at Tesla and see that this company’s P/E ratio is currently over 1000, it does bring pause and perspective into the mix.

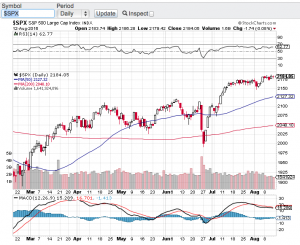
Back to the indexes that appear to be out of balance. As the S&P 500 (see chart here) and the Nasdaq Composite (see chart below) continue to set records, the majority of stocks have not returned to their pre COVID highs and still remain down on the year. This to me is something to pay attention to. Sure, some tech stocks deserve their current valuations due to how they are growing and benefiting from the widespread lockdowns. Tech stocks and the technologies they provide are serving businesses and consumers alike in a way no one would of thought of before the pandemic took hold of our country. However, even stocks like Apple have high seen quite the expansion of its P/E multiple which is currently trading at 39. Bottom line for me, as we are setting records each week, I would prefer to see a broader base rally to ensure that we are not out of balance with each and every record that is being set.

Good luck to all 🙂

~George

Are The Indexes Out Of Balance? - Paula Mahfouz


An Absolutely Incredible Stock Market!

It is absolutely incredible that this stock market is weathering the threat of impeachment! We have witnessed the strongest bull market in history! Not even the threat of impeachment can rattle this market. I do not want to get too political here but if half of this is true the markets just don’t care. Then throw into the mix the constant flip flopping that is going on with the China trade war and we are still near all-time highs? This makes me believe more now than ever that passive investing has almost got a total grip on stocks. Seemingly NOTHING can shake these markets. It’s almost like close your eyes and hang on for the ride. This worries me a bit. Why? Well for starters stocks used to be valued by their proprietary nature, growth potential, earnings power and ultimate dividend yields. We have witnessed a melt up in the stock market for more than a decade despite the shocks that have come and gone. What’s more is the geopolitical risks that are here and present and now our own President is going through an impeachment process and we still are near all time highs? Simply an absolutely incredible stock market we find ourselves in!

Well there is an old saying on Wall Street and that is the “trend is your friend!” My friends there is no denying this over the past decade. Let’s also keep in mind that the market is a lot smarter than we think. Meaning, there is no panic with this latest tape bomb of impeachment. Well one can say there is no way this President will get impeached because the Senate will not roll over. This very well may be the case. One thing we can do is pay attention to how corporate America continues to perform or not perform. At some point in time one would think that valuations will matter and that the markets will begin to pay attention to the normal risks that are inherent with any market.

Good luck to all 🙂

~George


Geopolitical Risks Abound…

Stocks closed the shortened holiday week down on Thursday as the U.S. dropped the largest non-nuclear bomb on a target in Afghanistan. This just after the U.S. launched tomahawk missiles targeting a Syrian airbase in response to a chemical attack on innocent civilians in Syria. Now North Korea is increasing its verbal threats of an all out war on the United States. What’s going on here? It’s hard to talk about stocks when all of this hatred is occurring around the world. Nonetheless, the markets will move forward but will be certainly affected by the troubling geopolitical environment and the uncertainties that exist in multiple regions around the globe.

For the week, the Dow Jones Industrial Average (chart) closed down 1%, the S&P 500 (chart) closed off 1.19%, the Nasdaq (chart) -1.2% and the small-cap Russell 2000 (chart) finished the week lower by 1.39%. Gold (see chart below) was up on the week and for the first time since November of last year, closed above its 200-day moving average. This is no surprise due to what is currently going on in the world. The question now is how to trade this market environment or what to do with your current positions? If history repeats itself, market volatility should increase which is good for traders but can be unnerving to longer term investors. In fact volatility (chart) spiked this week to its highest level in 5 months.

Now that earnings reporting season is underway some market pundits are saying that this will dictate whether or not markets will continue higher or if earnings reporting season will be the catalyst to send stocks into correction mode. I disagree with this point of view. How can the markets concentrate on earnings reporting season when you have this widespread turmoil around the globe? Of course, earnings are what typically drive stocks and valuations but until the geopolitical back drop abates and a sense of resolve comes forward I will be ultra conservative in going long any equities unless it is gold or gold related assets. Of course it is always best to consult a certified financial planner(s) before making any investment decisions. Good luck to all and both Paula and I wish all a safe and Happy Easter weekend.

~George

gold chart george mahfouz jr

What August Swoon?

Actually quite the contrary! In fact new all time highs occurred this past week with the S&P 500 (see chart below), the Dow Jones Industrial Average (see chart below) and the Nasdaq (chart, click here). What’s more is these record closing highs of the aforementioned indexes occurred on the same day last week, a feat that has not happened since the bubble of 2000. Now I am not suggesting we are in a bubble like we were in dot-com days. Back then valuations of dot-com stocks and most of technology were rather insane. That said, the current price to earnings ratio of the S&P 500 is in the 20’s which is historically high. That alone could be a catalyst for a pause and consolidation and/or a pullback from the record high territory we have been trading in.

I am almost frightened to think or suggest that a retracement of any type is forthcoming simply due to the way the markets have been trading in a typically weak market season. As mentioned in my previous blog, August tends to be one of the weakest months of the year for the stock market. There is still a couple of weeks left in August and it is not too late to see historic trends surface. However, the way stocks have traded lately and with no real economic or geopolitical catalysts in the foreseeable future, this market melt-up may indeed continue.

Technically speaking, the trend lines of the 20-day, 50-day and 200-day moving averages all remain in tact and are yielding upward and the relative strength index of the key averages are not officially in overbought territory. So this is enough for me to not really expect much out of the market in either direction as we head into Labor Day weekend and as the summer winds down. Good luck to all 🙂

~George

S&P chart george mahfouz jr

dow jones chart george mahfouz jr

Volatility Wakes Up!

After weeks of tepid volatility (chart)  investors and markets appear a bit jittery with volatility waking up. For the week, the Dow Jones Industrial Average (chart) closed down 1.3%, the tech-focused Nasdaq (chart) closed off 2.7%, the S&P 500 (chart) closed lower by 1.3% and the small-cap Russell 2000 (chart) finished lower on the week by 1.4%. As first quarter earnings reporting season begins to wind down with overall results coming in mixed, we now enter a time of year where weakness in stocks can occur with volatility even more prevalent. The old adage “sell in May and go away” could come into play.

The currents risks to the market as I see it is the market itself as valuations are historically high with the S&P 500 price to earnings ratio trading in the 20’s. Another risk to stocks is the possibility of the Fed raising rates in June.  These catalysts alone could be all that it takes for equities to not only pause but to continue to experience increased volatility as we head into the summer months. So now let’s look at the technical shape of the aforementioned indexes. After trading near or in overbought territory for the past month or so the Dow Jones Industrial Average (chart) broke through its 20-day moving average, the S&P 500 (chart) also broke through its 20-day moving average, however, a bit more troublesome is the Nasdaq (chart)  as it has broke through its 200-day moving average this past week, a moving average that is more closely watched. Finally, the small-cap Russell 2000 (chart) is now sitting right at its 20-day and 200-day moving averages. So the technical shape of the markets at least according to moving averages support lines appear to be breaking down a bit.

So as we head into a typically softer time for equities that is May and June, and considering the current technical shape of the markets, both Paula and I feel it would be best to move to the sidelines and see if the current increase in volatility continues or if this is just a pause in the sharp rally we have seen since the middle of February.

Good luck to all 🙂

~George

What Correction?

I think it’s safe to say that the bulls took back control of the stock market, at least for now. After what seemingly was the beginning of a meaningful market correction in late January, stocks closed the month of February at or near record levels. For the month, the Dow Jones Industrial Average (chart) finished up 3.96%, the tech focused Nasdaq (chart) closed up almost 5%, the broad based S&P 500 (chart) closed at a new record high of 1859.45 and was up 4.3% in February, and the small-cap Russell 2000 (chart) finished the month in the green by 4.6%.

So what changed from the apparent sell-off in late January to today? In my view, absolutely nothing. We still have a very accommodative Fed, interest rates remain near zero and a new Fed chairwomen that essentially emulates the former head of the Federal Reserve Ben Bernanke, and his policies. Hence, markets remain flush with cash with no where else to go but into higher yielding assets. This in my humble opinion is why equities snapped back from their January declines and why new highs are occurring. The bears are wondering how much longer can this go on without sparking a potential problematic inflationary environment. The bears are also growling about the bubbly type market we find ourselves in with valuations beginning to get stretched a bit and the apparent stratospheric $19 billion price tag that Facebook (NasdaqGS: FB) recently paid for the 55 employee app company WhatsApp. Then you have electric car maker Tesla this week receiving a price target boost from Morgan Stanley (NYSE: MS) to $320 dollars, which is more than double what Morgan’s previous target price was. Other data supporting the bear thesis is margin interest remains at all time highs and the retail individual investor is coming back to life according to online trading discount brokers TD Ameritrade (NYSE: AMTD) and Charles Schwab (NYSE: SCHW) which are seeing a surge in trading activity. Some pundits argue that this is the type of market behavior that is conducive with market tops. All valid points. My take is both the bulls and bears have valid points, but personally I cannot bet against the power of the central bank and their incessant support of the markets. When and only when the asset purchase program concludes and when interest rates begin to rise, we can then have a different type of discussion.

That said, we can easily see pullbacks and corrective type actions in the marketplace like we witnessed in late January. When volatility does come back, I would expect a similar pattern of market participants coming in looking for potential bargains, and thus placing yet another floor under these markets. On the technical front, it appears that all systems a go with none of the key indices in overbought territory yet according to the Relative Strength Index (RSI) however, yesterday we did see a “quasi-reversal” of sorts in where we closed well below the sessions highs after the S&P 500 (chart) hit an all time intraday high. This reversal was apparently due in large part to the increasing tensions in the Ukraine late Friday afternoon, which is something I will pay close attention to next week.  In closing, whether you are bullish or bearish, make sure to always consider having protective stops in place with your positions which is designed to protect your portfolio against unexpected losses.

Have a great weekend 🙂

~George