Hot Inflation Number Spooks Markets!
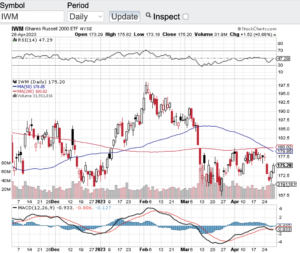
On Friday stocks took it on the chin as a hot inflation number spooked the markets! The latest producer price index report which measures wholesale inflation came in on Friday much higher than expected (click here). This was enough to send the Dow Jones Industrial Average (see chart here) down over 500 points on Friday, while the S&P 500 (see chart here) pulled back 30 points. The Nasdaq Composite (see chart here) also fell sharply giving up 210 points and the small-cap Russell 2000 (see chart here) settled down 45 points to close out the month February.
So why the negative tape? Inflation is one of the two pillars in the Federal Reserve’s dual mandate on interest rates. The Fed has made it clear that it will not lower interest rates should inflation continue to rise. This hot inflation number is not what investors wanted to see hence the sell-off in the markets on Friday. The other pillar in the Fed’s mandate is a strong job market. Well, here is the catch 22, the job market has been obliterated over the past year and this calls for the Fed to lower rates to stimulate job growth. Rates have been lowered over the past few months, but the Fed also made it clear that no more interest rate cuts will occur until inflation gets under control. Not an easy backdrop for the Fed to navigate.
As I look at the technical shape of the market, I am a bit concerned here in the short term. Friday’s selloff was enough to send the major averages below their 50-day moving averages. What’s more with Iran being bombed over the weekend and a new war being started this will create even more volatility which will most likely send stocks even lower. There are some supports zones including the 200-day moving averages of the indexes, albeit the 200-day M/A’s on the averages are much lower. What I have learned over the years is patience over panic while having protective stops in place (click here).
Good luck to all 🙂
~George