Healthy Corrective Action – Or Something More?

Are we in a healthy correction or is this something more? The recent market selloff including yesterday’s 500 point drop on the Dow Jones Industrial Average (see chart here) has caught the attention of investors and traders alike. The S&P 500 (see chart here) experienced its toughest month in over a year closing down almost 5%. The Nasdaq Composite (see chart here) was lower by over 5% in the month of September. It is not too surprising that the major averages were weaker to close out the third quarter. Historically, September and October for that matter are usually softer months for stocks.

So back to the question is this healthy corrective action or the beginning of a meaningful drawdown? The answer depends on who you ask or how you are interpreting the Federal Reserve’s updated guidance to the monetary policies that the Fed has in place. It is hard to be bearish here based on where the Federal Reserve currently stands. In one breath we hear that “bond purchases” will start to taper off before year end. Then in another breath, the Fed continues to signal that they are prepared to support our economy in the event we experience another surge in Covid. My feelings are the Fed will not put the brakes on their easy monetary policies until such time that our country is out of this pandemic. One thing is for sure, each upcoming Fed policy meeting and subsequent guidance will be put under a microscope more now than ever.

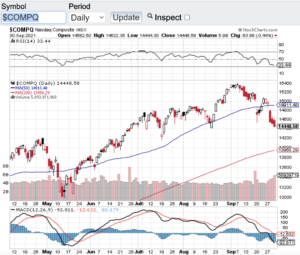
Let’s take a quick gander at the technical shape of the aforementioned indexes. The Dow Jones Industrial Average (see chart here) closed yesterday just below 34000 with its 200-day moving average currently at 33360. The S&P 500 (see chart here) closed yesterday at 4307 while also breaching and closing below its 100-day moving average. The Nasdaq Composite (see chart below) closed the month of September at 14448 also breaching its 100-day moving average. So the current technical set up could mean more downside ahead, but on the other hand, if these moving averages hold and acts as support, we could see a strong relief rally.

Good luck to all šŸ™‚

~George

Healthy Corrective Action - Or Something More? - Paula Mahfouz


Super week for stocks!

Stocks rallied for the second straight week as the key indicesĀ have now just about recaptured all of their losses incurred in August. The Dow Jones Industrial Average (chart) had one of its best weekly showings of the year gaining over 3%, the Nasdaq (chart) closed the week up 1.7%, the S&P 500 (chart) +1.98% and the small-cap Russell 2000 (chart) finished the week up 2.37%. Over the past couple of years, time and time again whenever equities as a whole have had a five percent pullback or so, such as what we experienced in August, a significant rally ensues and the bull market seemingly resumes. They say markets are forward looking indicators, well we must be in store for quite the year-end closeout, or are we?

This upcoming week the FOMC meeting will take center stage. The debate is on as to whether or not the Fed will start reducing its bond and mortgage back securities purchasesĀ and what effect this could have on the markets. My feelings are that there is still enough tepid economic data coming in for the Fed not to begin to taper. However, there are plenty of pundits out there that argue that the economy is beginning to show pockets of strength which could give the Fed the green light to begin with a small reduction with their future purchases. Either way, the technicals are now on their way to overbought territory, and interest rates are continuing to rise with the 10-year treasury noteĀ (chart) closing in on 3%.Ā This could be a one-two punch to once again slow down and even potentially reverse this most recent rally.

That said, if you are a technical trader, this is an almost perfect environment to trade in. Support levels are continuing to be honored as well as resistance marks. We now find ourselves butting up against the upper end of the trading range in the S&P 500 (chart) and we could very well be headed back to support levels which in this case would be the 1630 zone on the S&P (chart). If the markets embrace the Fed’s action or lack thereof, a breakout above the all time high of 1709 of this key index could very well be in the cards.

Good luck to all and have a great week šŸ™‚

~George