Are The Major Averages Breaking Out?

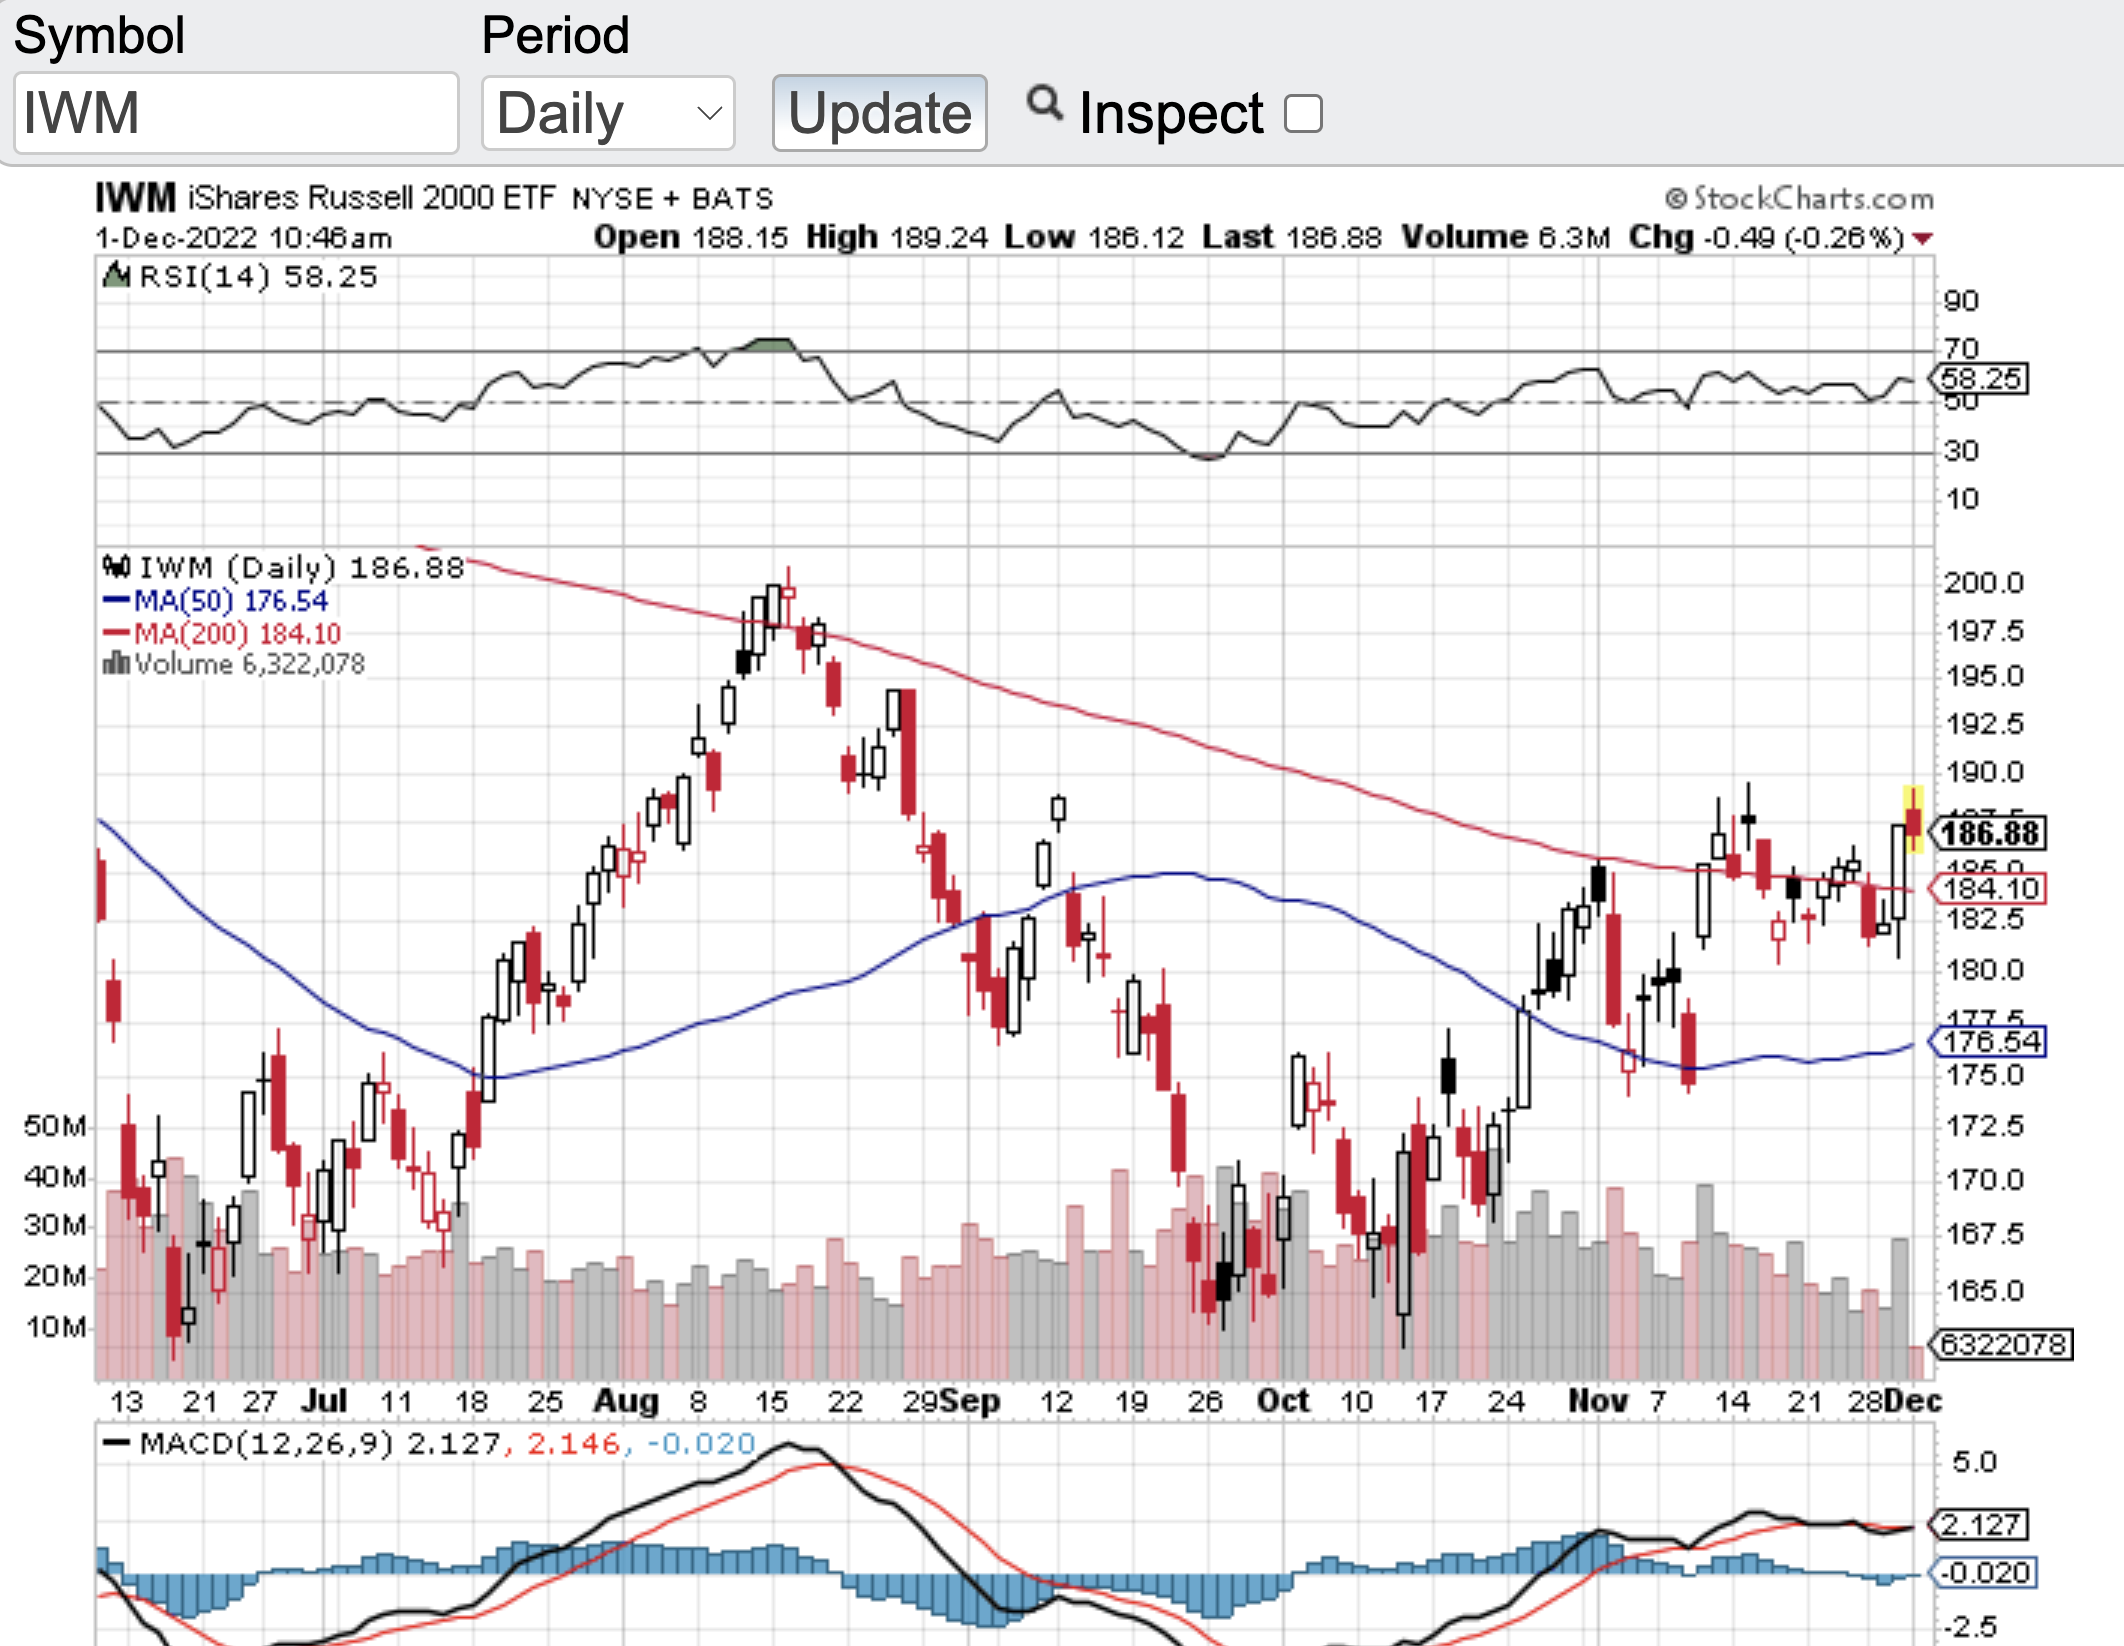
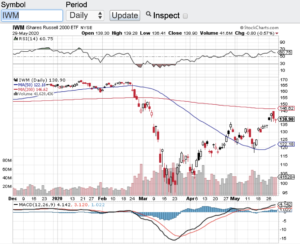
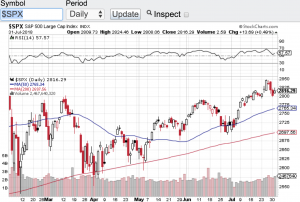
After breaching their respective 200-day support lines in March, the major averages appear to be breaking out of their months long trading range. The Dow Jones Industrial Average (see chart here), the S&P 500 (see chart here), the Nasdaq Composite (see chart here) and the small-cap Russell 2000 (see chart here) are all hitting monthly highs. Also, each of these indices appear to have strong momentum heading into July.

So why are the rally caps on? I think one of the drivers to this latest rally is how economy is faring. From the most recent GDP (gross domestic product report ) coming out stronger than expected to how inflation appears to be abating. Most every pundit expects our country to head into a recession, however, economic reports such as cited above are currently demonstrating a different backdrop. Market expectations have kept stocks in a trading range for the past several months until now.

The question now becomes is this a true “breakout” or is it a fake out? One catalyst that could answer this question is the upcoming Q2 earnings reporting season. Now that the second quarter of the year are in the books, corporate America will begin to report their Q2 earnings results here in July. This to me could prove whether or not this rally has more room to run.

When I look at the technical shape of the key indexes we are not yet in overbought territory according to the relative strength index aka the RSI. The only index that is near the 70-value level of the RSI is the S&P 500. According to the principles of the RSI, any index, stock, commodity etc. that trades above the 70 value of the RSI is considered overbought and we are not there yet. However, if this current rally continues then we could see the aforementioned indexes go into overbought territory. If this is the case, remember stocks and indexes can remain overbought for an extended period before reversion to the mean occurs.

Wishing everyone a safe and great 4th of July holiday weekend.

~George


Trying To Make Up Its Mind!

Seemingly, the markets are trying to make up their mind on whether to breakout or breakdown. Over the past couple weeks, the Dow Jones Industrial Average (see chart here), the S&P 500 (see chart here), the Nasdaq Composite (see chart here) and the small-cap Russell 2000 (see chart here and below) have all been consolidating in a very tight trading range. As you can see in the charts of these major averages, consolidation has occurred while also finding support at their 100 and 200-day moving averages. These tight trading ranges along with moving average support bodes well for an inevitable break from this current trading range . The question is will the markets breakout before year end or breakdown and through their respective moving averages support lines?

Let’s face it, we are currently in a bear market and rightfully so. It has been repulsive to see how inflated asset prices were during the heart of the pandemic. Stimulus was abound, interest rates remained at all-time lows and then speculation went from reasonable to very disturbing. This recipe set up the bear market and then Federal Reserve launched it by aggressively raising interest rates. My comment to that is what took them so long? The Fed had no choice to but to start raising rates and inflation took off to levels not seen in over 40 years. The silver lining to all the above is that finally we are moving towards a market that is now more trustworthy. Trustworthy from the standpoint that stocks may actually start trading at reasonable levels to where opportunities can be found. In fact, it is possible that certain stocks and sectors for that matter will overshoot to the downside to where great opportunities could come to the forefront.

As mentioned above, stocks are currently trading in a tight trading range and have support at their moving averages. However, with year-end approaching and as traders and investors reposition their portfolios I would not be surprised if we exit this tight trading range the markets have been in.

Good luck to all 🙂

~George

A Breakout Or A Fake-out?

The major averages seemingly are on the verge of a breakout, or could it be a fake-out? The Dow Jones Industrial Average (see chart here) has recaptured the 25000 level. The S&P 500 (see chart here) has recaptured the 3000 level. The Nasdaq Composite (see chart here) believe it or not is in striking distance of its all-time high and the small-cap Russell 2000 (see chart below) is also setting up for a breakout on its own. It is beyond impressive how the markets have come roaring back since late February. There are certain pundits out there that believe that this is a classic bear market rally however to me it feels like more than that. I have to believe that one of the main reasons why stocks have come roaring back in such a short period of time is the $ trillions of dollars in liquidity that the Federal Reserve and our government has injected into the markets and the economy. In fact, the Federal Reserve has quietly indicated that it is possible that they themselves would buy stocks if needed. Talk about establishing a floor in the stock market!

Another key development in the markets is how strong the technicals look right now. Without a doubt the leadership group of this recent rally is the Nasdaq Composite (see chart here). Tech stocks have benefited the most due to the lockdown. There are more people online than ever before, hence more sales accordingly. Since mid-April, not only has the Nasdaq cleared its 200-day moving average, it also has cleared its 50, 100 and 20-day moving averages. So now the Nasdaq is trading above all of its key moving averages which is bullish. Furthermore, the Dow Jones Industrial Average (see chart here) the S&P 500 (see chart here) and the small-cap Russell 2000 have also broken above some key technical resistance levels. Another technical indicator I look at the relative strength index also known as the RSI. At this point in time the aforementioned indexes are not in overbought territory. The RSI is a momentum indicator and when the value level of the RSI goes above 70 stocks or indexes begin to become overbought. This is currently not the case.

Good luck to all 🙂

~George

A Breakout Or A Fake-out - Paula Mahfouz


Did Apple Just Save Tech?

Tech stocks have been battered lately but as in the past Apple just might of saved tech stocks, at least for the time being. After the close, Apple reported an astonishing $53 billion in revenues growing at a 17% clip. What’s more is Apple’s profits rose more than 30% coming in at a whopping $11.5 billion in profits. I thought there is a thing called the law of large numbers? Apparently not at Apple! People don’t realize how hard it is to grow a company of this size in the way Apple continues to grow. Year after year, quarter after quarter, simply amazing. The question now becomes is yesterday’s earnings beat by Apple enough to put a floor in tech stocks. Technology stocks have been taken out to the woodshed as of late with seemingly no end in sight, until yesterday. What I will be looking for today and for the rest of the week is whether or not companies continue get sold off after their earnings release which has been the trend this particular earnings reporting season.

In my last blog I eluded to the possibility of a breakout of the S&P 500 (chart) or a triple top fade in the index.  Quite honestly neither really happened, at least not yet. The S&P 500 (see chart below) essentially has been trading in a range between 2800 and 2850. Earnings reporting season has yet to be the catalyst for such a breakout or breakdown for that matter. Triple tops are very powerful to the technical set-up on any given index or stock for that matter. Apple’s earnings could very well be the catalyst for the markets to once again challenge the current triple top formation. Now that we are in August I do think we will get that answer soon enough. I do expect volatility to pick up a bit here in August which is not uncommon for this time of year. The SPY’s (chart) which tracks the S&P 500 (chart) has demonstrated support at its 20-day moving average which is essentially $279.50 and the overhead resistance is essentially the $285.00 zone. Let’s see if the S&P can break away from either line. Good luck to all 🙂

~George

S&P 500 - George Mahfouz Jr.

Triple Top Or Breakout?

After chopping between the 2700 and 2800 zone for the past couple of months, is the S&P 500 (chart) at a triple top, or is it ready to breakout? I think we are going to find out this week in which second quarter earnings reporting season kicks into high gear. Although volatility has reared its head in first half of 2018, vol now has come back to what the markets have been accustomed to over the past few years (see chart below). Whether we breakout and test all time highs is a head scratcher. Of course earnings will play a key role in which way the markets will go, but there are other market moving factors in the mix. Any minute President Trump could put out a tweet on trade which could kill the most recent rally in stocks or propel it to new highs. On Tuesday and Wednesday, Federal Reserve Chairman Jerome Powell will speak in front of the Senate Banking Committee and the House Financial Services Committee. Without a doubt investors will be paying close attention to the tone and context of Chairman Powell’s testimony in front of both committees. Oh yes, we must not forget the Trump/Putin summit and I can’t even guess what comes out of that meeting and how the markets will react. So as you can see, chance are we will breakout of the triple top we are in or pullback within the trading range as mentioned above.

This week kicks off with high flying Netflix (NasdaqGS:NFLX) which reports their quarterly results tomorrow after the close, followed by Goldman Sachs (NYSE: GS) on Tuesday along with Johnson & Johnson (NYSE: JNJ), T-Mobile (NYSE: TMUS) and rounding the week out we will hear from the likes of Alcoa Corp (NYSE: AA), American Express (NYSE: AXP), eBay Inc. (NasdaqGS: EBAY), International Business Machines (NYSE: IBM), Etrade Financial Corp. (NasdaqGS: ETFC), Intuitive Surgical (NasdaqGS: ISRG), Microsoft Corp. (NasdaqGS: MSFT), General Electric (NYSE: GE) and Honeywell International Inc. (NYSE: HON) just to name a few. Good luck to all 🙂

~George

VIX - George Mahfouz Jr.

Are Stocks Poised To Breakout?

After an early November sell-off, the major averages could be on the verge of a breakout, at least from a technical point of view. The noticeable dip in equities that occurred recently was met with strong support and now stocks have rallied up to key resistance levels. The Dow Jones Industrial Average (chart) closed the month of November at 17720, the Nasdaq (chart) closed at 5109, the S&P 500 (chart) closed at 2075 and the small-cap Russell 2000 (chart) closed the month of November at 1198. As you can see by their charts the three top indices have resistance levels of 18,000, 5175 and 2125 respectively while the small-cap Russell 2000 (chart) is seemingly on the verge of breaking out. That said, it takes more than a day or two trading above a resistance level with strong volume to confirm a breakout. What could be in favor for a breakout with all of the aforementioned indexes is the seasonality of the markets a.k.a. the Santa Clause rally. This could very well be the catalyst for a year-end rally.

What could get in the way of a potential Santa Clause rally? One example could be if the technical resistance line(s) holds true to form and the key indices cannot breakout with conviction above these marks . There is also the risk of China’s market continuing to abate as regulators are cracking down on trading practices of major Chinese brokerage firms. The China weakness can spill over here to our shores even if it is only a short-term consequence. Of course there is always a geo-political risk that could weigh in on market sentiment and behavior. And last but not least, the Good Ole Federal Reserve and whether or not they would implement their first rate hike in almost a decade when they meet later this month.

That said and notwithstanding any of these risks, we have seen stocks incredibly resilient during this multi-year bull run and I would not be surprised if we indeed breakout and experience a year-end rally that could challenge the all time highs. Good luck to all 🙂

~George