What A Month For Stocks!

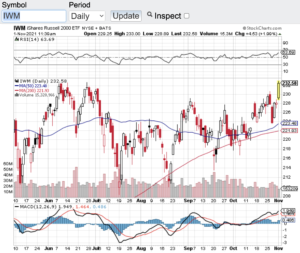
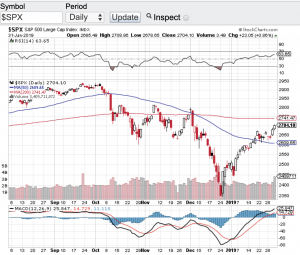
What a month for stocks as the major averages rebounded sharply in July. After witnessing an incessant selloff over the past few months, July turned out to be the best month for stocks in years. After falling into bear market territory, the S&P 500 (see chart here) gained almost 10% last month cutting its year to date losses in dramatic fashion. As I look at the Dow Jones Industrial Average (see chart here) a thousand-point gain in the last week or so is not too shabby either. Last but not least, both the Nasdaq Composite (see chart here) and the small-cap Russell 2000 (see chart here) also has enjoyed a strong recovery from their recent lows.

So why was there such a strong performance in the month of July? Q2 earnings reporting season is in full swing and at best this Q2 earnings so far have been a mixed bag. The Fed last week also raised interest rates another 0.75%. Inflation remains at or near 40-year highs. So, if you solely look at these metrics one would think the recent selloff would be accelerating. Clearly this is not the case, yet! The bears would argue that this is an “oversold” bounce and part of me agrees with that. However, I think it is too early to say that we are back to a full-fledged bull market. I do think if the markets remain stable over the next couple of months this could be a sign of a bottoming process. Let’s see how the rest of the summer plays out.

Now let’s move over to the technical shape of the aforementioned indexes. What has caught my eye is how the major averages are either at or have recaptured their 100-day moving average. This important support and/or resistance line is key as to whether stocks will pause into the resistance that moving averages experience, or if the momentum continues, then this could mean that this latest bull run will continue.

Good luck to all 🙂

~George

Strong Earnings – Record Highs!

Last month I asked “Is this a healthy correction or something more?” and based on how strong earnings have been along with record highs, I think it is fair to say last months action was more of a healthy pullback than anything else. The Dow Jones Industrial Average (see chart here) is at an all-time high trading above the 36000 mark, the S&P 500 (see chart here) has also hit an all time high today, the Nasdaq Composite (see chart here) has also joined the all-time high club and the small-cap Russell 2000 (see chart here) is within striking distance of its all-time high.

The most recent catalyst for stocks and indexes hitting their all-time highs are earnings. 80 percent of the companies on the S&P 500 that have reported their Q3 earnings so far have beat Wall Street expectations. There are still 1000’s of companies set to report over the coming weeks but if trend continues we could very well be seeing more records set. Along with a strong earnings reporting season no question the Fed continues to encourage all investors to participate due to how low interest rates remain. For most investors there are not many options right now to generate meaningful returns other than the stock market or the high flying crypto space which remains incredibly volatile and extremely risky.

Now let’s take a look at the technical backdrop of the aforementioned indexes. The Dow Jones Industrial Average (see chart here) is trading comfortably above its key moving averages and not quite overbought according to the relative strength index (RSI) and the same can be said for the S&P 500 (see chart here) and the Russell 2000 (see chart below). However, the Nasdaq Composite (see chart here) has just breached the 70 value level of the RSI which is the pure definition of a stock or index becoming overbought. Note, stocks and/or indexes can remain overbought for extended periods of time before a turn.

One of the oldest adages on Wall Street is the trend is your friend and it is clear where the trend has been and where it will most likely go. That said, it is always best to consult with your certified financial planner/advisor if you are considering any portfolio additions, deletions or adjustments.

Good luck to all 🙂

~George

Strong Earnings - Record Highs - Paula Mahfouz

Earnings And The Fed!

Stocks took off this week and we can blame earnings and the Fed! Now that we are fully into earnings reporting season the investors so far have liked what they see. Couple that with the Federal Reserve coming out on Wednesday stating that the central bank is “changing its tune” on interest rates, and you have a one-two bull market punch. Also on Wednesday, Fed Chairman Powell stated “the case for raising rates has weakened somewhat” and that the Federal Reserve will be more patient toward further rate hikes. Stocks rallied hard on the Fed’s new position along with stronger than expected earnings reports that are coming in from corporate America. For the month of January, The Dow Jones Industrial Average (see chart here) is up over 2000 points, the S&P 500 (see chart below) is also up over 200 points, the Nasdaq Composite (see chart here) is up 800 points and the small-cap Russell 2000 (see chart here) closed out the month of January up 175 points. January 2019 has been one of the best performing months in years.

Let’s take a look at the technical shape of the markets from a moving averages perspective. The Dow Jones Industrial Average (chart) has just broken through its 200-day moving average, while the S&P 500 (chart) and the Nasdaq Composite (chart) are both sitting on its 100-day moving average and the small-cap Russell 2000 (chart)is not too far behind. There are still plenty of earnings reports that will be released over the next few weeks and to me this is the remaining catalyst that could drive stocks higher here in the short term. Let’s keep in mind there are still other catalysts on the horizon that could put the brakes on this most recent rally with the government having yet another deadline to reach a deal on border security and of course the looming tariff deal with China. If one or both of these deals do not get done, I think we will be having a different conversation in March. Until then, let’s enjoy the current wave of positive news and market action and then see what kind of adjustments that would possibly need to be made. Good luck to all 🙂

~George

S & P 500 - Paula Mahfouz


Stocks Skittish Before The Fed Meeting…

Stocks have become hesitant as to which direction to head into with all eyes now on whether the Federal Reserve will raise interest rates this week for the first time in almost a decade. The Dow Jones Industrial Average (chart) started the week down 62.13, the Nasdaq Composite (chart) closed Monday’s session out down 16.58, the S&P 500 (chart) fell 8 points and the small-cap Russell 2000 (chart) closed modest lower by 4.3 points.

As investors and traders await the decision from the Federal Reserve as to whether or not a rate increase will occur, I think the markets are putting too much emphasis on the initial hike, regardless if it’s announced after the conclusion of their two-day meeting this week. To me what’s more is how will the Federal Reserve respond over the coming months and quarters ahead? Shouldn’t we be more attuned to their behavior pattern after the first hike? Or whether or not they will raise rates at an accelerated rate? To me this is the bigger question. Of course a quarter point rate hike or even a 50 basis point hike is in the cards and is inevitable at some point in time, whether it’s this week or at the Federal Reserve’s future meetings. My focus and attention will be on how they treat the interest rate environment after the first rate hike actually occurs. Based on the temperament and demeanor of Janet Yellen, I would expect a continuing cautious protocol from our Fed Chair and I would think that neither she or the Fed would not be inclined to raise rates too fast. I would think the economic data would dictate the velocity of future rate hikes and even if the data becomes robust, the Federal Reserve would want to see multiple quarters of meaningful expansion before we get back to normalized rates.

That said, I do think that the markets and investors are going to need to get used to increased volatility and market swings similar to what we have been experiencing over the past few months. I believe gone are the days of low vol and indeed investors are going to need to pay attention now more than ever to the true growth rates of companies, especially on the top-line. You see in a rising interest rate environment companies can no longer grow their bottom line alone while maintaining high valuations. Real growth needs to come forward in the form actual sales expansion in addition to productivity in order for companies to maintain elevated P/E multiples. Bottom line, you better know the companies you choose to invest in because the free lunch so to speak that the markets, investors and traders have enjoyed over the past several years may come to a close in the near future…

Good luck to all 🙂

~George

Fears Of A Greek Default Rattles Stocks…

The International Monetary Fund (IMF) which is owed a payment of $1.6 billion euros walked out on Thursday’s meeting when both sides were attempting to negotiate a pact to save Greece from defaulting on its debts and prevent the country from heading into bankruptcy. This stalemate was enough to send global markets lower as well as our own. The Dow Jones Industrial Average (chart) closed Friday’s session down 140 points, the Nasdaq (chart) finished lower by 31 points, the S&P 500 (chart) lost almost 15 points and the small-cap Russell 2000 (chart) closed lower by almost 4 points. This type of uncertainty is never good for the markets especially when markets are essentially at all time highs. People are already a bit nervous that stocks may be overheated and should default chatter increase, this could set the wheels in motion for the “sell-off” certain pundits have been calling for.

This upcoming week the Fed will also hold its two day meeting as market participants will be watching closing to see if any of the Fed’s language will change pertaining to the state of the economy and interest rates. I do not think anyone is expecting too much from the FOMC at this meeting. If market volatility increases, I am quite sure it would be Greece related rather than what the Federal Reserve may or may not say out of their policy meeting.

Friday’s selling pressure did send both the Dow Jones Industrial Average (chart) and the S&P (chart) 500 below their respective 50-day moving averages which is where they also closed. For the past few weeks all of the aforementioned key indices have been flirting with their 50-day moving average and each time they crossed this key support line buyers came in taking the indexes back through this well defined metric. I think it’s too early to tell if what’s happening in the global macro picture will continue to effect our markets or if this is just another pause in our incessant bull market. Have a great week and good luck to all 🙂

~George

Once Again, All Eyes On The Fed…

Stocks closed lower last week for the first weekly decline of the broad indices in over a month. The Dow Jones Industrial Average (chart) closed the week down 1%, the Nasdaq (chart) -0.3%, the S&P 500 (chart) closed lower by 1.1% and the small-cap Russell 2000 (chart) also finished the week lower by almost 1%. I suppose a bit of a pullback was overdue considering how much the market has gained over the past five weeks or so. Some of the chatter is that this most recent weakness is due in part to the upcoming Fed policy meeting next week, and the expectation that the Fed is on the brink of changing its language pertaining to interest rates. Between strong economic growth and healthy corporate balance sheets, it’s no wonder analysts are expecting a shift in demeanor over at the Fed. Furthermore, oil has dropped significantly since late June which is finally beginning to show up at the pump. Lower gas prices is a positive for the consumer which could add more fuel to the economy, no pun intended. But wait a minute, the job market recently has done an about face with less hirings occurring in the month of August, which could give the Federal Reserve a reason not to put the brakes on so quickly. Personally, I think the Fed will become a bit more vocal   regarding rising rates over the coming months.

So what could this mean for stocks in the near term? For one, I expect more volatility between now and year end. Especially as it pertains to the upcoming third quarter earnings reporting season. We all know that the Fed will end its asset purchase program in October, and then next logical step for them is to begin to raise interest rates at some point in time. So corporate America sooner than later will have to stand on its own two feet and show top-line growth in order to appease investors and maintain their valuations. See, the accommodative policies over the past five years or so has in part given companies a pass so to speak if they weren’t growing their top-lines. What a lot of companies have done over the past few years is clean up their balance sheets by becoming more efficient by way of trimming expenses and implementing stock buyback programs. This of course in many instances improved their earnings and bottom lines, while not really growing their top-lines. Which is why I view the upcoming Q3 earnings reporting season as potentially one of the defining moments in this historic bull run we have enjoyed over the past five years. This could also be a “Goldilocks” moment where the Fed ends its asset purchase programs, begins to gently raise rates with minimal inflation in sight, and corporate America demonstrates top-line growth. This is what Janet Yellen and the Federal Reserve would call the perfect set-up. I, like most investors would love to see this theme play-out. However, let’s not forget the multi-trillion dollar balance sheet that the Fed has incurred during this unprecedented time of monetary accommodation, and as of now, no one really knows what type of impact this will ultimately have on our economy and our markets. Good luck to all and have a great week 🙂

~George


What Correction?

I think it’s safe to say that the bulls took back control of the stock market, at least for now. After what seemingly was the beginning of a meaningful market correction in late January, stocks closed the month of February at or near record levels. For the month, the Dow Jones Industrial Average (chart) finished up 3.96%, the tech focused Nasdaq (chart) closed up almost 5%, the broad based S&P 500 (chart) closed at a new record high of 1859.45 and was up 4.3% in February, and the small-cap Russell 2000 (chart) finished the month in the green by 4.6%.

So what changed from the apparent sell-off in late January to today? In my view, absolutely nothing. We still have a very accommodative Fed, interest rates remain near zero and a new Fed chairwomen that essentially emulates the former head of the Federal Reserve Ben Bernanke, and his policies. Hence, markets remain flush with cash with no where else to go but into higher yielding assets. This in my humble opinion is why equities snapped back from their January declines and why new highs are occurring. The bears are wondering how much longer can this go on without sparking a potential problematic inflationary environment. The bears are also growling about the bubbly type market we find ourselves in with valuations beginning to get stretched a bit and the apparent stratospheric $19 billion price tag that Facebook (NasdaqGS: FB) recently paid for the 55 employee app company WhatsApp. Then you have electric car maker Tesla this week receiving a price target boost from Morgan Stanley (NYSE: MS) to $320 dollars, which is more than double what Morgan’s previous target price was. Other data supporting the bear thesis is margin interest remains at all time highs and the retail individual investor is coming back to life according to online trading discount brokers TD Ameritrade (NYSE: AMTD) and Charles Schwab (NYSE: SCHW) which are seeing a surge in trading activity. Some pundits argue that this is the type of market behavior that is conducive with market tops. All valid points. My take is both the bulls and bears have valid points, but personally I cannot bet against the power of the central bank and their incessant support of the markets. When and only when the asset purchase program concludes and when interest rates begin to rise, we can then have a different type of discussion.

That said, we can easily see pullbacks and corrective type actions in the marketplace like we witnessed in late January. When volatility does come back, I would expect a similar pattern of market participants coming in looking for potential bargains, and thus placing yet another floor under these markets. On the technical front, it appears that all systems a go with none of the key indices in overbought territory yet according to the Relative Strength Index (RSI) however, yesterday we did see a “quasi-reversal” of sorts in where we closed well below the sessions highs after the S&P 500 (chart) hit an all time intraday high. This reversal was apparently due in large part to the increasing tensions in the Ukraine late Friday afternoon, which is something I will pay close attention to next week.  In closing, whether you are bullish or bearish, make sure to always consider having protective stops in place with your positions which is designed to protect your portfolio against unexpected losses.

Have a great weekend 🙂

~George

Now That’s What I Call A Bounce!

After such a torrid bull run in 2013, where the the four major averages gained over 25%, to no great surprise, these same indexes experienced more than a 5% pullback in January and early February. However, over the past couple of weeks and true to form, these indexes not only bounced off of key technical support zones, but they also took back their 50-day moving averages. For the week, the Dow Jones Industrial Average (chart) finished up 2.28%, the Nasdaq (chart) had a gain of 2.86%, the S&P 500 (chart) +2.32% and the small-cap Russell 2000 (chart) closed the week up 2.92%. The markets responded with a roar as the new Fed chairwomen Janet Yellen, in her first public appearance at the helm of the Fed, reiterated her commitment to model after the Bernanke era monetary policies. Stocks were already recovering from the January correction but accelerated their gains as she spoke to Congress this past Tuesday. All expectations now are that stocks will remain buoyed by the continuing asset backed purchases despite the modest tapering that is now in effect.

In my previous blog I expressed concern over the technical breakdown of the markets and that the 50-day moving averages of the key indices had been breached. Furthermore, I thought there was a possibility of the 200-day being the next stop. However, I did also indicate that if the markets were able to rebound and take back their 50-day and remain above that mark, that would be a positive. This is where we find ourselves now. All of the aforementioned key indexes have traded and closed above this key technical metric. The question now becomes whether or not this slingshot bounce and break above the 50-day is sustainable? Q4 earnings reporting season really didn’t say too much about the growth of corporate America, which overall was a mixed bag at best for the majority of the sectors. Couple this with economic signs of weakness as retail sales growth still remains flatlined, and I think we will continue to experience choppy waters for stocks, and I would be surprised if we began making new high after new high like last year. That said, liquidity for stocks is seemingly plentiful and we are still in a strong seasonality period for equities, so I also wouldn’t be surprised if we stabilized above the 50-day and consolidated for an extended period of time. Unless of course there is an unexpected negative geopolitical or global macro event that creeps back into the mix, then all bets are off. I will continue to track the technicals to gauge entry and exit points while using protective stops along the way. Good luck to all and both Paula and I wish everyone a very safe and happy Presidents’ Day holiday. Please note the markets are closed on Monday in recognition of Presidents’ Day.

Have a great weekend 🙂

~George

Happy New Year!

If 2014 comes anywhere near the performance the overall markets experienced last year, once again the bulls will be popping champagne. For the year 2013, the Dow Jones Industrial Average (chart) closed up a breathtaking 26.5%, the Nasdaq (chart) finished the year up a staggering 38%, the S&P 500 (chart) booked a spectacular gain of almost 30% and the small-cap Russell 2000 (chart) soared 37%. I think it’s safe to say that an exact repeat of 2013’s performance is highly unlikely, but there is seemingly no reason to believe that this momentum won’t continue into the new year. Even the key indices in Europe had very impressive double digit gains in 2013 with the German DAX index leading the way surging 26% on the year.

With that said, the first thing that pops out to me is that the aforementioned key indices are all now near or completely in overbought territory according to the Relative Strength Index (RSI) technical indicator. We have been monitoring these indexes since October of 2013 to see when they may go into extreme overbought conditions and with the powerful year end close, we now have 3 of the 4 key indexes officially in overbought territory with the Russell 2000 (chart) only a few value points to go. So what does this all mean for the investor or even more so, to the trader? By now all of you know that I personally view the RSI as a reliable technical indicator distinguishing whether an index or stock for that matter is overbought or oversold. In fact, certain computer algorithmic trading models are designed to act whenever extreme conditions occur in a given market or stock. Let’s recap the definition of the Relative Strength Index or the RSI. In the most simplest terms, the RSI is designed to demonstrate whether or not an index or equity is overbought or oversold, depending on certain value levels. According to the RSI principle, the 70 value level or greater, is an overbought condition and the 30 value and below is an oversold condition. And as mentioned the majority of the key indices along with dozens of stocks are now in overbought territory. This doesn’t mean that we will all of a sudden see a dramatic turn in the opposite direction, however, typically when stocks or indexes are in overbought or oversold conditions such as they are now, at some point in time, a change of direction ensues.

The wild card that will most certainly continue to play out is of course the Federal Reserve and what course of action they will take and uphold in 2014. Especially now that the Fed has started to reduce its asset purchases. We all know that the accommodative policies of the Fed over the past few years has placed a floor under these markets and whenever any attempt of a pullback or mini-correction has occurred, that condition has been met with unprecedented support, hence new market highs followed. I would expect as long as the Fed continues to support the bond and mortgage backed securities markets, even at a reduced rate, whatever pullbacks or retracements that do occur, buyers will be anxiously awaiting to add to their positions or open new ones.

I do expect a healthy 5%, 10% or even 15% correction in 2014 and if you have the gumption to go short, this could serve you well. Of course no one knows if or when this correction may take place, however, as highlighted, we are now in overbought territory which could be one of the catalysts to prompt a pullback or even a subtle correction. Should we get this healthy correction, we will be looking into the financial and technology sectors to identify opportunities to capitalize on. Please note this is not a recommendation to go short or long any asset or index, and it is prudent to consult with a certified financial planner(s) before making any investment decisions.

Good luck to all and both Paula and I wish everyone a very safe, prosperous and Happy New Year 🙂

~George

Super week for stocks!

Stocks rallied for the second straight week as the key indices have now just about recaptured all of their losses incurred in August. The Dow Jones Industrial Average (chart) had one of its best weekly showings of the year gaining over 3%, the Nasdaq (chart) closed the week up 1.7%, the S&P 500 (chart) +1.98% and the small-cap Russell 2000 (chart) finished the week up 2.37%. Over the past couple of years, time and time again whenever equities as a whole have had a five percent pullback or so, such as what we experienced in August, a significant rally ensues and the bull market seemingly resumes. They say markets are forward looking indicators, well we must be in store for quite the year-end closeout, or are we?

This upcoming week the FOMC meeting will take center stage. The debate is on as to whether or not the Fed will start reducing its bond and mortgage back securities purchases and what effect this could have on the markets. My feelings are that there is still enough tepid economic data coming in for the Fed not to begin to taper. However, there are plenty of pundits out there that argue that the economy is beginning to show pockets of strength which could give the Fed the green light to begin with a small reduction with their future purchases. Either way, the technicals are now on their way to overbought territory, and interest rates are continuing to rise with the 10-year treasury note (chart) closing in on 3%. This could be a one-two punch to once again slow down and even potentially reverse this most recent rally.

That said, if you are a technical trader, this is an almost perfect environment to trade in. Support levels are continuing to be honored as well as resistance marks. We now find ourselves butting up against the upper end of the trading range in the S&P 500 (chart) and we could very well be headed back to support levels which in this case would be the 1630 zone on the S&P (chart). If the markets embrace the Fed’s action or lack thereof, a breakout above the all time high of 1709 of this key index could very well be in the cards.

Good luck to all and have a great week 🙂

~George