Strongest Performance In 5 Years…

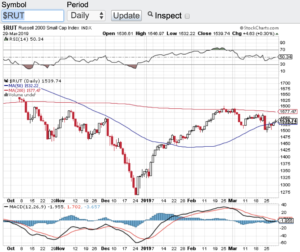
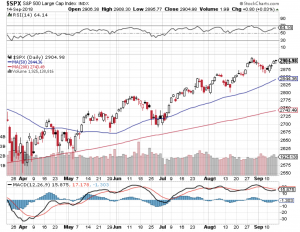
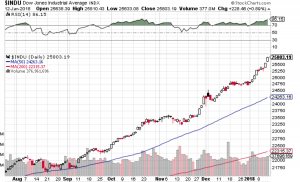
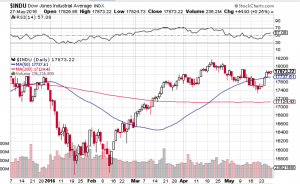
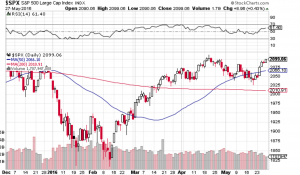
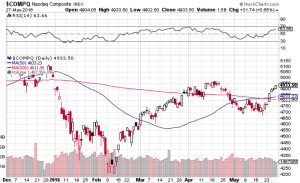
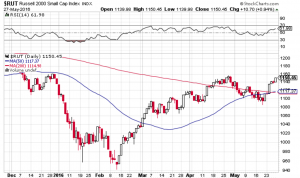
Stocks took off in the first quarter with the S&P 500 (see chart here) delivering its strongest Q1 performance in 5 years gaining over 10%. The Dow Jones Industrial Average (see chart here) also closed Q1 with a gain of 5.6%, the Nasdaq Composite (see chart here) finished the quarter up over 9% and the small-cap Russell 2000 (see chart here) finished up around 5%. So, as I posted last month, stocks continue their record setting ways.

So why are the markets continuing to demonstrate strength despite interest rates remaining high relative to when this bull market started? I think part of the answer is right there. The Federal Reserve is continuing to indicate that three interest rate cuts remain in place for 2024 which is bullish for the markets.

Another first quarter driver of the markets can be attributed to the “Magnificent 7”. Nvidia (Symbol: NVDA), Meta Platforms (Symbol: Meta), Amazon (Symbol: AMZN), Microsoft (Symbol: MSFT), Alphabet (Symbol: GOOGL), Apple (AAPL) and Tesla (TSLA) are the Magnificent 7 and are responsible for 40% of the S&P 500’s (see chart here) gain in Q1. This dynamic too attributed to the momentum stocks witnessed in the first quarter although there are a couple of chinks appearing in the armor of the Magnificent 7 and that is the recent under performance of Apple and Tesla. Personally, I would like to see a broader rally here not just 7 stocks that are making up a big percentage of the overall gains.

That being said, and now that the first quarter of the year is in the books, earnings reporting season begins here in April. Earnings season should be the next catalyst as to where stocks and indexes go. As I just spoke to, I would like to see a broader based rally and Q1’s earnings results just might deliver results that could extend this year’s impressive rally. However, if corporate America issues flat to softer results, we could see a pause in this rally and even a potential pullback.

Good luck to all 🙂

~George

Are The Major Averages Breaking Out?

After breaching their respective 200-day support lines in March, the major averages appear to be breaking out of their months long trading range. The Dow Jones Industrial Average (see chart here), the S&P 500 (see chart here), the Nasdaq Composite (see chart here) and the small-cap Russell 2000 (see chart here) are all hitting monthly highs. Also, each of these indices appear to have strong momentum heading into July.

So why are the rally caps on? I think one of the drivers to this latest rally is how economy is faring. From the most recent GDP (gross domestic product report ) coming out stronger than expected to how inflation appears to be abating. Most every pundit expects our country to head into a recession, however, economic reports such as cited above are currently demonstrating a different backdrop. Market expectations have kept stocks in a trading range for the past several months until now.

The question now becomes is this a true “breakout” or is it a fake out? One catalyst that could answer this question is the upcoming Q2 earnings reporting season. Now that the second quarter of the year are in the books, corporate America will begin to report their Q2 earnings results here in July. This to me could prove whether or not this rally has more room to run.

When I look at the technical shape of the key indexes we are not yet in overbought territory according to the relative strength index aka the RSI. The only index that is near the 70-value level of the RSI is the S&P 500. According to the principles of the RSI, any index, stock, commodity etc. that trades above the 70 value of the RSI is considered overbought and we are not there yet. However, if this current rally continues then we could see the aforementioned indexes go into overbought territory. If this is the case, remember stocks and indexes can remain overbought for an extended period before reversion to the mean occurs.

Wishing everyone a safe and great 4th of July holiday weekend.

~George


Stocks End Q1 On Fire!

Stocks ended the first quarter of the year on fire! The Dow Jones Industrial Average (see chart here) closed Q1 up over 11%, the S&P 500 (see chart here) closed the first quarter up over 12% which is the best performing quarter in years for this bellwether, the Nasdaq Composite (see chart here) closed up more than 17% and the small-cap Russell 2000 (see chart below) closed out the first quarter of the year up over 14%. Yes folks these gains are incredibly impressive especially considering how global growth is slowing. That said, these eye-popping market gains are not too surprising considering the sharp sell-off that stocks experienced in that latter part of 2018. Without a doubt the aforementioned indexes were way oversold in late December and an oversold bounce of some sort was definitely in the cards. As we know, market swings can and do overshoot to downside such as what we saw in late 2018 and now the question is, will we overshoot to the upside?

It sure does not appear that way at least from a technical perspective and according to the Relative Strength Index (RSI). The Dow Jones Industrial Average (see chart here), the S&P 500 (see chart here), the Nasdaq Composite (see chart here) and the small-cap Russell 2000 (see chart here) are no where near overbought conditions yet. This despite all of these key indices rallying double digits in Q1. What’s more, all but one of these indices are also trading above their key moving averages including their 20-day, 100-day and 200-day with the lone exception being the small-cap Russell 2000. Now there could be some consolidation going on here over the next few weeks and up until first quarter earnings reporting season begins which would actually be healthy for the markets.

Speaking of the upcoming earnings reporting season, this could be the one catalyst that sheds the most light for the rest of the year on how stocks will fare. It is no secret global growth has slowed and I think corporate America will speak to whether this current global slowdown is just a blip on the radar or something much more meaningful.

Good luck to all 🙂

~George

Russell 2000 - Paula Mahfouz


Traders And Investors Are Awaiting A September Selloff…

Traders and investors are awaiting a September selloff that actually may not come. Stocks continue to demonstrate strength and resiliency despite the political turmoil in Washington DC, rising interest rates and a seasonality headwind that just isn’t happening. August and September are typically weaker months for the stock market, instead the S&P 500 (see chart below), the Nasdaq Composite (chart) and the small-cap Russell 2000 (chart) hit all-time record highs and the end of August and despite a mini pullback shortly thereafter, the markets appear to have stabilized near all time highs. The Dow Jones Industrial Average (chart) did not make an all-time high in August, however, this index remains within striking distance of its all time high. The pundits are speaking to the strength of corporate America where earnings and profits are at their highest levels in decades as to the reason why the markets are not selling off. What is undeniable is that any time stocks have experienced a pull back it has been met with support from institutional investors and retail investors alike.

Speaking of support, let’s take a closer look at the technical shape of the aforementioned key indexes. Let’s start with the S&P 500 (chart). After pulling back to its 20-day moving average the S&P is right back at a breakout point. Next week we should see if the S&P can indeed breakout or fail and head back to its 20-day. The Nasdaq Composite index (chart) has similar chart pattern although it traded a bit below its 20-day support line for a few days before recapturing its 20-day and is now trading above it. A look at the Russell 2000 (chart), it too closed above its 20-day moving average and last but not least the Dow Jones Industrial Average (chart) also closed above its 20-day and this index is also right at a breakout or breakdown point. These bellwether indexes are also not in an extreme overbought condition according to the Relative Strength Index. The RSI tracks overbought or oversold conditions and is a momentum indicator that measures the degree and velocity of recent price changes to determine what is overbought and what may be oversold. We are simply not in any extreme condition according to the RSI principle.

Let’s see how the back half of September plays out and we will revisit the technical set-up of the markets in October. Good luck to all 🙂

~George

S&P 500 - George Mahfouz Jr


1000 Points In 7 Trading Days?

I am not even sure what to say here, almost 1000 points in 7 trading days? After closing above the 25,000 mark for the first time ever on January 4th, the Dow Jones Industrial Average (see chart below) is now closing in on the 26,000 mark in a matter of days. I simply do not understand how this bellwether index can notch 1000 point gains in such a short period of time. In fact most of the major averages are continuing to set records almost daily. How long can this go on? Without question we are on the brink of the strongest bull market in recorded history. The Dow Jones Industrial Average (chart) closed the week at a record 25,803.19, the S&P 500 (chart) closed at a record 2,786.24, the Nasdaq Composite (chart) closed at a record high of 7,261 and the small-cap Russell 2000 (chart) closed the record setting week at 1,591.90. The market was boosted on Friday in part by the strong quarterly earnings results of JP Morgan Chase.

Speaking of earnings reporting season, this week truly is the start of earnings reporting season in which most analysts expect strong top and bottom line growth from corporate America. Over the past few years the markets did witness strong bottom line growth in which a lot of that growth was due to improved efficiencies and reductions of the workforce. Now the opposite is occurring. The economy is expanding as is the job market. This should bode well for not only company earnings but for the continuation of the bull market. That said, I would think that a pullback of any kind is in the cards and I would also expect that investors and traders would be there in support of a retracement.

From a technical point of view equites are clearly overbought according to the relative strength index also referred to as the RSI. However, this favorite technical indicator has not provided the guidance and reliability as it usually does simply because these markets have remained overbought for one of the longest stretches I can remember. There will be a time where the RSI will become more reliable as it once was, but in my humble opinion you will need a “normal” market environment for this to be the case. Good luck to all 🙂

~George

dow jones - george mahfouz jr

Russell 2000 – All Time High!

So now the small-caps join in! The Russell 2000 (chart) closed the week at an all time record high of 1490. For most of the year the widely followed small-cap Russell 2000 has lagged the other major averages. Now it has broken out, see (chart). In fact, when you look at the chart of the Russell, one can say this index has gone parabolic. The Nasdaq (chart) and the S&P 500 (chart) also closed at their all time highs on Friday, while the Dow Jones Industrial Average (chart) posted yet another positive week. What’s more is the month of September is typically one of the weakest months of the year for equities losing on average of 1.5% happening 70% of the time since the 1970’s. Not this year, in fact there have been so many record-breaking closes on all of the aforementioned indices it’s hard to keep track.

Question is, now what? With the third quarter of the year now in the books, Q3 earnings reporting season is right around the corner. I have got to believe with the Federal Reserve closing the chapter on their quantitative easing policy and now taking those assets off of their books, plus interest rates scheduled to rise, investors should pay closer attention to the health and growth of corporate earnings. Do you remember the days when earnings and earnings growth actually mattered? Well those days may be back upon us. Hence, the report cards that come in from corporate America may actually move the markets in a fundamental way. This we have not seen in almost a decade. However, if the market momentum that we have experienced since the election continues, and investors ignore the fundamentals, then why couldn’t we end the year at even higher highs?

One thing for sure is October will be filled with many catalysts that should bring in some volatility and a lot of opportunity.  Between now and year end may be the time to implement a hedged strategy where one can potentially profit regardless of how the indexes or individual stocks react to what’s ahead. I’ll cover this in my next blog. Good luck to all. 🙂

~George

Rate Hikes Are Looming…

Janet Yellen the chair of the Federal Reserve last Friday signaled that the Federal Reserve is prepared to raise interest rates in the coming months should the U.S. economy continue to improve. Some pundits suggest that a rate hike could come at the Fed’s next policy meeting in two weeks. Despite the rate hike chatter, the markets continue to shrug off what seemingly could be bearish for stocks. The Dow Jones Industrial Average (see chart below) is within striking distance of all time highs. Same can be said for the S&P 500 (see chart below), the Nasdaq (see chart below) finds itself flirting once again with the 5000 mark and the small-cap Russell 2000 (see chart below) appears to have caught a bid and is strengthening.

This type of market activity is counterintuitive when interest rates appear to be heading north. The flip side to this thinking is if the Federal Reserve is willing to raise rates due to a stronger economic back-drop, one can assume that this must be good for corporate America. Logically speaking I agree, however, if history has anything to do with the markets, a rising interest rate environment typically does not bode well for equities. Couple this with the seasonality of the summer months which tend to be weaker months for stocks and the upcoming fall presidential election, and I would say at the very least we will see a rise in volatility. These are very powerful forces that are lining up and I think it’s safe to say the markets will be very reactive to these events.

So what’s a trader or investor do in this landscape? For me personally I think the type of environment we are heading into creates opportunity on the long and short side. I will be paying close attention to overbought and oversold conditions of the markets and select equities throughout the summer and into the fall. As everyone knows by now my favorite technical indicator when it comes to spotting overbought/oversold conditions is the Relative Strength Index also known as the RSI. Many market technicians also favor this technical indicator when assessing market conditions from a technical standpoint. Over the years the RSI has demonstrated its usefulness and if you are not familiar with this technical indicator, you may want to research it out. Click here for starters.

Both Paula and I wish everyone a very safe, prosperous investing and trading summer 🙂

~George Mahfouz, Jr.

Screen Shot 2016-05-30 at 8.00.40 PMGeorge Mahfouz Jr. S&P 500 chartGeorge Mahfouz Jr. Nasdaq ChartGeorge Mahfouz Jr. Russell 2000 Chart


Rough Quarter For Stocks…

Although the markets rallied yesterday, the major averages in Q3 closed lower for the second straight month. In fact, year to date the Dow Jones Industrial Average (chart) is down 8.6%, the Nasdaq (chart) is off by 2.5%, the S&P 500 (chart) is lower by 6.8% and the small-cap Russell 2000 (chart) year to date is down 8.6%. So the bulls are asking what gives? My question is more of what has taken so long? The U.S. markets have not seen any kind of meaningful or long lasting correction in six years. This is not a surprise and if anything should be embraced. Stocks have been driven by the Federal Reserve policies ever since the introduction of the first quantitative easing mandate. How easy has this market been? All any investor or fund manager really had to do over the past 6 years is buy and hold with no need for concern. I think it’s safe to say the landscape is changing and rightfully so. There are many investors out there that missed this stunning bull run we have been on simply because it was hard to agree with the valuations that most of the market has enjoyed during the Federal Reserve buyback program and low interest rate stance. Top-line growth has really not been the catalyst that has driven stocks during this incessant bull market. However, when you are in a low to negative interest rate environment there really isn’t any other option to place funds. The question now is are we heading towards or already in a normalized market environment? Meaning will equities now begin to trade on their own merits? To me it certainly feels like the markets are setting up this way.

We won’t have to wait very long because third quarter earnings reporting season is just ahead. Without question I expect this upcoming earnings reporting season will be scrutinized like no other in recent memory. I believe gone are the days that investors will give any company a pass should their results come in under street estimates or even in-line with the street. For me personally there is too much volatility in the marketplace right now and my preference is to go to the sidelines until after Q3 earnings reporting season is over. I will then evaluate the landscape from a fundamental and technical point of view. Speaking of the technical shape of the market, this too of a concern of mine. All of the key indices are in a significant down trend trading well below their respective 200-day moving averages. Yes theses indexes are finding a bit of support right here, but if earnings reporting season doesn’t add up, new 52 week or even multi-year lows could be in the cards? My point here is that with the way the markets look and feel, it is probably best to be a bit more conservative until after we see the health and growth rate of corporate America. Good luck to all 🙂

~George

Tough Day For Stocks…

Stocks took it on the chin today with most of the major averages closing in the red. On the day, the Dow Jones Industrial Average (chart) closed down 279.47 points, the Nasdaq (chart) closed lower by 75.97 points, the S&P 500 (chart) closed the day off by 23.81 points and the small-cap Russell 2000 (chart) lost 21.04 points. Fears from Asia to Europe are spilling over in to U.S. Equities. Securities regulators in China are banning certain types of equities financing which will have an effect on margin trading. Furthermore, across the pond in Europe, investors are becoming more worried about Greece and whether or not that country will be able to make payments on debts that are coming due and whether or not Greece will even stay in the eurozone.

Despite today’s selloff, Q1 earnings have not been too shabby so far, especially out of the banking sector. Earlier this week, JP Morgan (NYSE: JPM) reported a $5.91 billion dollar profit or $1.45 per share surpassing most analysts expectations and Citigroup (NYSE: C) also exceeded analysts expectations by posting a $1.51 per share in earnings compared to the $1.39 per share the street expected. The stock that caught everyones attention this week was Netflix (NasdaqGS: NFLX). Netflix (chart) reported in their earnings release that almost 5 million subscribers came online compared to the 4 million analysts anticipated. This metric alone gave Netflix’s stock a boost of almost $90 dollar a share yesterday.

Fast forward to next week and we will get earnings results out of Morgan Stanley (NYSE: MS), Verizon (NYSE:V), United Technologies Corp (NYSE: UTX), Yahoo (NasdaqGS: YHOO), Boeing (NYSE: BA), eBay (NasdaqGS: EBAY), Facebook (NasdaqGS: FB), Qualcomm (NasdaqGS: QCOM), The Coca-Cola Co (NYSE: KO), Tractor Supply Co. (NasdaqGS: TSCO), 3M Co (NYSE: MMM), Amazon (NasdaqGS: AMZN), Eli Lilly & Co. (NYSE: LLY), General Motors (NYSE: GM), Google (NasdaqGS: GOOGL), Microsoft (NasdaqGS: MSFT), Newmont Mining (NYSE: NEM), Southwest Airlines (NYSE: LUV), Starbucks Corp (NasdaqGS: SBUX) and Biogen (NasdaqGS: BIIB) just to name a few. I think it’s safe to say we will get a very broad look as to how corporate America is faring after all of these earnings results come forward.

Have a great weekend and good luck next week 🙂

~George