A Sell The News Environment?

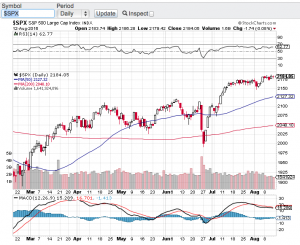
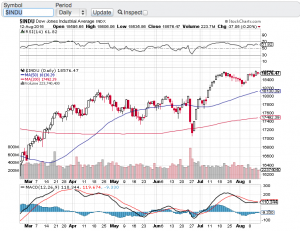
We are almost at the midway point of earnings reporting season and it appears that we are in a “sell the news” type environment. Amazon (Symbol: AMZN), Intel (Symbol: INTC), Bank of America (Symbol: BAC) JP Morgan Chase (Symbol: JPM) are amongst other high profile companies that have smashed it out of the park with their latest quarterly earnings reports and yet the market does not seem to care. At best stocks have gone sideways with breakout moments only, only to find themselves priced back where they started before their earnings reports. One could say that stocks have already priced in their respective growth and the markets seem to agree. To close out the month of April, the Dow Jones Industrial Average (chart) closed at 24,163, the S&P 500 (chart) finished the month at 2648, the Nasdaq Composite (chart) closed at 7066 and the small-cap Russell 2000 (chart) settled at 1542.

As mentioned above, we are around the mid-point of the season and there are still hundreds of companies that are set to report their earnings this week which includes the likes of: Apple (NasdaqGS: AAPL), Devon Energy Corp. (NYSE: DVN), Gilead Sciences Corp. (NasdaqGS: GILD), Snap Inc (NYSE: SNAP), Avis Budget Group (NYSE: CAR), Caesars Entertainment Corp (NYSEL CZR), CVS Health Corp. (NYSE: CVS), Estee Lauder Companies Inc. (NYSE: EL), Holly Frontier Corp. (NYSE: HFC), Mastercard Inc. (NYSE: MA), MetLife Inc. (NYSE: MET), Yum! Brands Inc. (NYSE: YUM), Avon Product Inc. (NYSE: AVP), CBS Corp. (NYSE: CBS), Ferrari NV (NYSE: RACE), Kellogg Co. (NYSE: K), Shake Shack Inc. (NYSE: SHAK), Sprouts Farmers Market Inc. (NasdaqGS: SFM), Weight Watchers International Inc. (NYSE: WTW), Celgene Corp. (NasdaqGS: CELG) and Cheniere Energy Corp (NYSE: LNG). These are just a few of the names that report this week and as you can see there is a wide variety of companies that could potentially move the market from its most recent sideways action. Good luck to all 🙂

~George


Geopolitical Risks Abound…

Stocks closed the shortened holiday week down on Thursday as the U.S. dropped the largest non-nuclear bomb on a target in Afghanistan. This just after the U.S. launched tomahawk missiles targeting a Syrian airbase in response to a chemical attack on innocent civilians in Syria. Now North Korea is increasing its verbal threats of an all out war on the United States. What’s going on here? It’s hard to talk about stocks when all of this hatred is occurring around the world. Nonetheless, the markets will move forward but will be certainly affected by the troubling geopolitical environment and the uncertainties that exist in multiple regions around the globe.

For the week, the Dow Jones Industrial Average (chart) closed down 1%, the S&P 500 (chart) closed off 1.19%, the Nasdaq (chart) -1.2% and the small-cap Russell 2000 (chart) finished the week lower by 1.39%. Gold (see chart below) was up on the week and for the first time since November of last year, closed above its 200-day moving average. This is no surprise due to what is currently going on in the world. The question now is how to trade this market environment or what to do with your current positions? If history repeats itself, market volatility should increase which is good for traders but can be unnerving to longer term investors. In fact volatility (chart) spiked this week to its highest level in 5 months.

Now that earnings reporting season is underway some market pundits are saying that this will dictate whether or not markets will continue higher or if earnings reporting season will be the catalyst to send stocks into correction mode. I disagree with this point of view. How can the markets concentrate on earnings reporting season when you have this widespread turmoil around the globe? Of course, earnings are what typically drive stocks and valuations but until the geopolitical back drop abates and a sense of resolve comes forward I will be ultra conservative in going long any equities unless it is gold or gold related assets. Of course it is always best to consult a certified financial planner(s) before making any investment decisions. Good luck to all and both Paula and I wish all a safe and Happy Easter weekend.

~George

gold chart george mahfouz jr

Dow 21,000 Are You Kidding?

This market is unbelievable! As I am writing this blog the Dow Jones Industrial Average (chart) has eclipsed the 21,000 mark. This after President Donald Trump’s first speech to the joint session of Congress. Not only has the Dow breached 21,000, the Nasdaq (chart) has also set a new record this morning at 5,875, the S&P 500 (chart) has set a new record of 2,384 and counting, the small-cap Russell 2000 (chart) has hit a new record high and even the Dow Jones Transportation Average (chart) has set a new record high this morning at 9567.

It’s been exactly one month since the Dow Jones Industrial Average (chart) topped the 20,000 mark and now catapulting through 21,000! It’s inconceivable that the Dow has tacked on yet another 1,000 points in a month. The bears must be in shock! I am not exactly sure what President Trump said last night that is any different from what he has already promised during his campaign and during his inaugural speech in January. One would think that the markets have already priced in the “huge” corporate tax cuts Trump has promised. Also, I thought that the markets have also priced in the proposed $1 trillion dollar infrastructure spend. One thing for sure, right now the markets don’t care about valuations or the fact that it will take time for the Trump administration to figure out if the tax cuts or infrastructure spend as promised will even occur as designed?

I like to close my blogs out with the current technical take of the indexes. Quite honestly, the technicians are also baffled about this tape. The Dow Jones Industrial Average (chart) remains in extremely overbought conditions as does the S&P 500 (chart). The Nasdaq (chart) just re-entered overbought territory according to the relative strength index and the small-cap Russell 2000 (chart) is heading in that direction. We are witnessing one of the strongest bull markets in history!

Good luck to all 🙂

~George


What August Swoon?

Actually quite the contrary! In fact new all time highs occurred this past week with the S&P 500 (see chart below), the Dow Jones Industrial Average (see chart below) and the Nasdaq (chart, click here). What’s more is these record closing highs of the aforementioned indexes occurred on the same day last week, a feat that has not happened since the bubble of 2000. Now I am not suggesting we are in a bubble like we were in dot-com days. Back then valuations of dot-com stocks and most of technology were rather insane. That said, the current price to earnings ratio of the S&P 500 is in the 20’s which is historically high. That alone could be a catalyst for a pause and consolidation and/or a pullback from the record high territory we have been trading in.

I am almost frightened to think or suggest that a retracement of any type is forthcoming simply due to the way the markets have been trading in a typically weak market season. As mentioned in my previous blog, August tends to be one of the weakest months of the year for the stock market. There is still a couple of weeks left in August and it is not too late to see historic trends surface. However, the way stocks have traded lately and with no real economic or geopolitical catalysts in the foreseeable future, this market melt-up may indeed continue.

Technically speaking, the trend lines of the 20-day, 50-day and 200-day moving averages all remain in tact and are yielding upward and the relative strength index of the key averages are not officially in overbought territory. So this is enough for me to not really expect much out of the market in either direction as we head into Labor Day weekend and as the summer winds down. Good luck to all 🙂

~George

S&P chart george mahfouz jr

dow jones chart george mahfouz jr

Volatility Wakes Up!

After weeks of tepid volatility (chart)  investors and markets appear a bit jittery with volatility waking up. For the week, the Dow Jones Industrial Average (chart) closed down 1.3%, the tech-focused Nasdaq (chart) closed off 2.7%, the S&P 500 (chart) closed lower by 1.3% and the small-cap Russell 2000 (chart) finished lower on the week by 1.4%. As first quarter earnings reporting season begins to wind down with overall results coming in mixed, we now enter a time of year where weakness in stocks can occur with volatility even more prevalent. The old adage “sell in May and go away” could come into play.

The currents risks to the market as I see it is the market itself as valuations are historically high with the S&P 500 price to earnings ratio trading in the 20’s. Another risk to stocks is the possibility of the Fed raising rates in June.  These catalysts alone could be all that it takes for equities to not only pause but to continue to experience increased volatility as we head into the summer months. So now let’s look at the technical shape of the aforementioned indexes. After trading near or in overbought territory for the past month or so the Dow Jones Industrial Average (chart) broke through its 20-day moving average, the S&P 500 (chart) also broke through its 20-day moving average, however, a bit more troublesome is the Nasdaq (chart)  as it has broke through its 200-day moving average this past week, a moving average that is more closely watched. Finally, the small-cap Russell 2000 (chart) is now sitting right at its 20-day and 200-day moving averages. So the technical shape of the markets at least according to moving averages support lines appear to be breaking down a bit.

So as we head into a typically softer time for equities that is May and June, and considering the current technical shape of the markets, both Paula and I feel it would be best to move to the sidelines and see if the current increase in volatility continues or if this is just a pause in the sharp rally we have seen since the middle of February.

Good luck to all 🙂

~George

Staying True To Form…

In late September stocks appeared to be heading to new 52 week and multi-year lows. But as this market has demonstrated its resilience during this six year bull run, the four major averages found support near its previous lows in late August and have bounced nearly 10%. This most recent market action have yet again muzzled the bear pundits and revived the bulls hopes for a possible year-end rally. For the week the Dow Jones Industrial Average (chart) closed modestly higher up 131.48 points, the Nasdaq (chart) had a weekly gain of 56.22 points, the S&P 500 (chart) finished up 18.22 points and the small-cap Russell 2000 (chart) bucked the uptrend falling slightly by 3.05 points.

So could there be a year-end rally in the cards? I think the answer to that question will come forward as we are now kicking into high gear with Q3 earnings reporting season. Already this past week we heard from the likes of JPMorgan Chase (NYSE: JPM), Citigroup (NYSE: C), Goldman Sachs (NYSE: GS) and international conglomerate General Electric (NYSE: GE) who all provided results investors could cheer about. Each one of these companies notched impressive gains on the week not only helping the key indices, but also instilling confidence with investors. However, and as we all know, earnings reporting season can be volatile and we are at just at the starting gate.

Next week we will get quarterly results from technology giant Broadcom (NasdaqGS:BRCM), oil and gas equipment services behemoth Halliburton (NYSE: HAL), Bank of New York Mellon (NYSE: BK), Chipotle Mexican Grill (NYSE: CMG), Yahoo (NasdaqGS: YHOO), biotech giant Biogen (NasdaqGS: BIIB), Coca-Cola Co. (NYSE: KO), General Motors (NYSE: GM), Las Vegas Sands Corp. (NYSE: LVS), Amazon.com Inc. (NasdaqGS: AMZN), E*Trade Financial Corp. (NasdaqGS: ETFC), basic materials giant Freeport-McMoRan Inc. (NYSE: FCX), Microsoft (NasdaqGS: MSFT) and American Airlines Group Inc. (NasdaqGS: AAL) just to name a few.

These are only a handful of companies scheduled to report next week with hundreds more to follow in the coming weeks. That said, both Paula and I will continue to remain patient and wait until after earnings reporting season before we consider any new market strategies.

Good luck to all 🙂

~George

Finally The Bulls And Bears Got What They Wanted!

A Correction! After years of not having a 10% or more correction in the markets and with August tending to be one of the worst performing months for equities, this was the perfect set-up for the long overdue correction in stocks to take place. However, just as fast as the stock market correction occurred, the ensuing snap back rally was equally eye-poping. For the month, the Dow Jones Industrial Average (chart) fell 6.57%, the tech focused Nasdaq (chart) lost 6.86%, the S&P 500 (chart) -6.26% and in the month of August the small-cap Russell 2000 (chart) experienced a 6.45% decline. Last week we did witness very rare market behavior with whipsaw action not seen since the 2008 financial market crisis. This brought back memories of how stocks and financial markets can irrationally behave as emotions and high frequency trading take over.

The question now is, is this type of market volatility over? I don’t think so. Let’s first take a gander of the technical health of the four major averages. Without question, short term technical damage in these key indices have occurred. Each one of the index have fallen sharply and have closed below their respective 200-day moving averages. Furthermore, today at the open and for the first time in years, the S&P 500 (chart) will have its 50-day moving average crossover its 200-day moving average. Technically and historically speaking, this is not usually a good thing. The Dow Jones Industrial Average (chart) saw its 50-day crossover its 200-day in the middle of August only to experience exhaustive selling thereafter. The good news technically is that stocks had been way oversold to the point 0f capitulation. Hence, the ensuing sharp rally from the most recent lows.

So where do we go from here? I suspect that we will continue to experience outsized market moves in both directions and trading this kind of market environment is not for the feint of heart. I revert back to a more conservative approach starting with identifying the most current “best of breed” in their respective industries. The first prerequisite for me in identifying potential investment candidates in this type of market environment is for companies to have pristine balance sheets with little to no debt levels. However, if they do have debt they must have have historic and current cash flows that can easily service their debt. Without this and in today’s market I have no interest on really owning anything. Of course there are many other metrics that do apply but for me personally the balance sheet is where it begins. Another huge factor for me especially today is to implement disciplined  “protective stops” in any positions I hold. This ensures that your portfolio is somewhat protected should the markets decide that we are in the early innings of this correction. With that said and especially in today’s market, please consider consulting with a trusted certified financial planner(s) before making any additions or modifications to your own portfolio.

Both Paula and I wish everyone a very safe and Happy Labor Day holiday weekend 🙂

~George


The Melt Up Continues…

Stocks continued their march north this past week as once again both the Dow Jones Industrial Average (chart) and the S&P 500 (chart) hit record highs on Thursday. Joining in on the action was the Nasdaq composite (chart) which hit a 52-week high on Thursday as well, while the small-cap Russell 2000 (chart) essentially closed flat on the week. We will talk more about this index in a bit.

With the mid-term elections in the rear view mirror and as the Thanksgiving holiday approaches, I do not see any reason as to why stocks in general won’t continue to post gains. Third quarter earnings reporting season for the most part has ended, and the scorecard was okay. You might look at the technical’s in the marketplace and see that we are at or heading into overbought territory. But when you have volatility coming in, the Thanksgiving holiday fast approaching and with no other real catalyst in the near term, it’s a perfect set-up for the status quo to remain in place. Here is the one exception; the small-cap Russell 2000 (chart). As the aforementioned key indexes have made all time highs, the Russell 2000 is lagging. Yes, this index too has rallied over 10% since the selloff in October, however, the Russell is running into significant resistance at the 1200 level, and actually has reversed course over the past two trading sessions (chart). It’s a bit early to call it a true reversal or a tell, but I will be keeping a close eye on how this key barometer pertaining to overall market sentiment will perform between now and year-end.

As far as the overbought conditions we find ourselves in according to the relative strength index, also known as the RSI, this is a prototypical environment where volatility is coming down and with not too many catalysts in the near term, I would not be surprised if we remain overbought through the end of the year. Good luck to all and both Paula and I wish everyone a Happy Thanksgiving holiday.

Have a great week 🙂

~George

Once Again, All Eyes On The Fed…

Stocks closed lower last week for the first weekly decline of the broad indices in over a month. The Dow Jones Industrial Average (chart) closed the week down 1%, the Nasdaq (chart) -0.3%, the S&P 500 (chart) closed lower by 1.1% and the small-cap Russell 2000 (chart) also finished the week lower by almost 1%. I suppose a bit of a pullback was overdue considering how much the market has gained over the past five weeks or so. Some of the chatter is that this most recent weakness is due in part to the upcoming Fed policy meeting next week, and the expectation that the Fed is on the brink of changing its language pertaining to interest rates. Between strong economic growth and healthy corporate balance sheets, it’s no wonder analysts are expecting a shift in demeanor over at the Fed. Furthermore, oil has dropped significantly since late June which is finally beginning to show up at the pump. Lower gas prices is a positive for the consumer which could add more fuel to the economy, no pun intended. But wait a minute, the job market recently has done an about face with less hirings occurring in the month of August, which could give the Federal Reserve a reason not to put the brakes on so quickly. Personally, I think the Fed will become a bit more vocal   regarding rising rates over the coming months.

So what could this mean for stocks in the near term? For one, I expect more volatility between now and year end. Especially as it pertains to the upcoming third quarter earnings reporting season. We all know that the Fed will end its asset purchase program in October, and then next logical step for them is to begin to raise interest rates at some point in time. So corporate America sooner than later will have to stand on its own two feet and show top-line growth in order to appease investors and maintain their valuations. See, the accommodative policies over the past five years or so has in part given companies a pass so to speak if they weren’t growing their top-lines. What a lot of companies have done over the past few years is clean up their balance sheets by becoming more efficient by way of trimming expenses and implementing stock buyback programs. This of course in many instances improved their earnings and bottom lines, while not really growing their top-lines. Which is why I view the upcoming Q3 earnings reporting season as potentially one of the defining moments in this historic bull run we have enjoyed over the past five years. This could also be a “Goldilocks” moment where the Fed ends its asset purchase programs, begins to gently raise rates with minimal inflation in sight, and corporate America demonstrates top-line growth. This is what Janet Yellen and the Federal Reserve would call the perfect set-up. I, like most investors would love to see this theme play-out. However, let’s not forget the multi-trillion dollar balance sheet that the Fed has incurred during this unprecedented time of monetary accommodation, and as of now, no one really knows what type of impact this will ultimately have on our economy and our markets. Good luck to all and have a great week 🙂

~George


First Half Of The Year In The Books, And The Bull Keeps Running…

After gaining 30% or so in 2013, the markets continue to be on one of the most impressive bull runs in modern history. Here is how the four key indices closed out the first half of 2014: The Dow Jones Industrial Average (chart) finished up 1.5%, the Nasdaq (chart) gained 5.5%, the S&P 500 (chart) advanced 6.1% and the small-cap Russell 2000 (chart) closed out the first half of 2014 up 2.6%. Looking back to the market lows of early 2009, these aforementioned indices have tripled or better in price, which is simply stunning.

I think now is as good a time than any to begin to take a look at how the major averages can continue to rise in spite of almost tripling over the past 5 1/2 years. What could be the catalyst(s) going forward? It’s no secret that the Federal Reserve is scaling back its asset purchases and are scheduled to be finished by year-end, so no surprise there. This in fact is where the bear camp is growling that the end of the Fed stimulus program could be the catalyst to end this historic bull run. What about corporate earnings? In my humble opinion, herein lies the single most important catalyst that will either add fuel to this incessant bull run or put the brakes on it. If it’s the latter, this could also create the first real correction in stocks, something that hasn’t occurred in years.

Investors will not have to wait too much longer for Q2 earnings reporting season is upon us. The first key earnings release that has economic implications will be Alcoa (NYSE: AA) which is due to report next Tuesday after the close. I will be very interested to see the top-line growth of Alcoa which will certainly shed some light as to the health of the global economy. Investors have been bidding up Alcoa most of the year in anticipation of an expanding global backdrop. Another economically sensitive stock at least as it pertains to the consumer is Family Dollar Stores (NSYE: FDO). Family Dollar is scheduled to report their quarterly results next Thursday before the market opens. Then by mid-July we will be in high gear to hear how corporate america fared in Q2. The week of July 14th, earnings are scheduled to come out of American Airlines (NYSE: AAL), American Express (NYSE: AXP), Blackrock ( NYSE: BLK), Citigroup (NYSE: C), Whirlpool Corp (NYSE: WHR), JPMorgan Chase (NYSE: JPM) Goldman Sachs (NYSE: GS), Johnson & Johnson (NYSE: JNJ), Intel (NasdaqGS: INTC), Yahoo (NasdaqGS: YHOO), Bank of America Corp (NYSE: BAC), Ebay (NasdaqGS: EBAY), U.S. Bancorp (NYSE: USB), Yum Brands (NYSE: YUM), Baker Hughes Inc (NYSE: BHI), UnitedHealth Group (NYSE: UNH),  Blackstone Group LP (NYSE: BX), International Business Machine (NYSE: IBM), Google (NasdaqGS: GOOGL), Bank of New York Mellon Corp (NYSE: BK) and General Electric (NYSE: GE) just to name a few. As you can see, I think it is safe to say that by the middle of July or so we will have a pretty good idea of how corporate America is faring.

Please note that in recognition of the 4th of July holiday, the markets will be closing at 1pm E.S.T. on Thursday and is closed on Friday the 4th. Both Paula and I wish everyone a very safe and happy 4th of July 🙂

~George